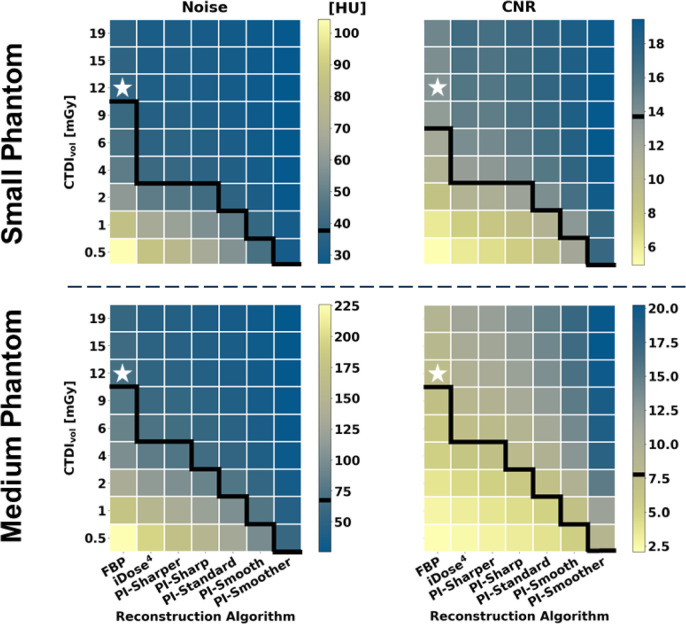
Figure 5.
Heatmaps displaying results of the image metric calculations for Noise (left) and CNR (right) from both the small phantom (top) and medium phantom (bottom). A white star is used to designate the dose and reconstruction combination used as the reference for statistical comparison for each metric. The value for this reference group is indicated on the color bars by a black line. The black lines on the heatmaps separate values that are statistically better than or equivalent to the reference (above the line) from those that are statistically worse than the reference (below the line).

