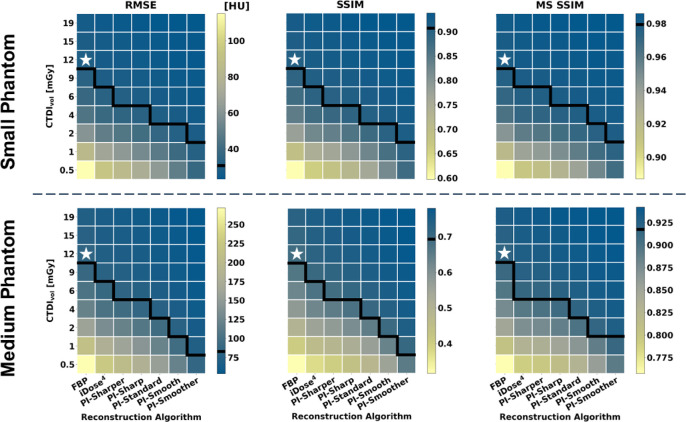
Figure 6.
Heatmaps displaying results of the image metric calculations for RMSE (left), SSIM (middle), and MS SSIM (right) from both the small phantom (top) and medium phantom (bottom). The white stars and black lines in this figure have the same function as in figure 5.

