
Figure 3.
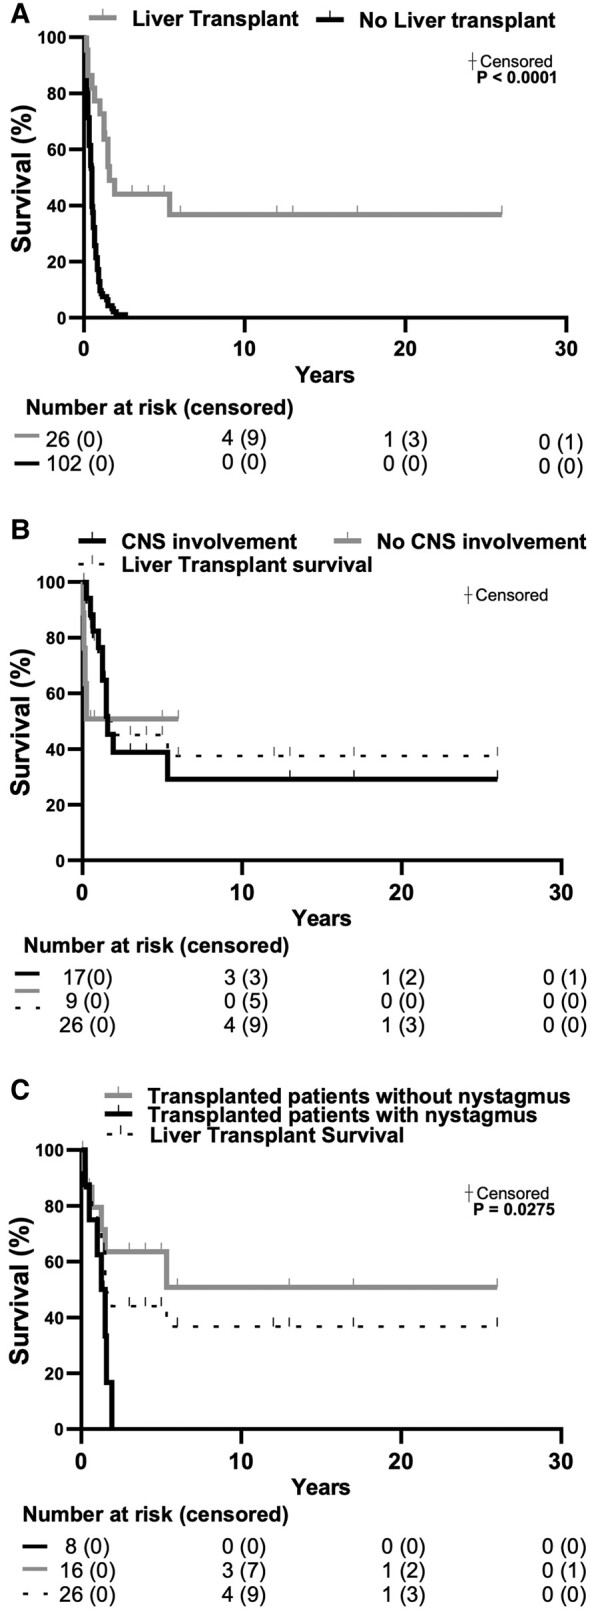
LTx outcome: (A) Survival curves comparing LTx versus untreated patients (n = 128). (B) Survival curve comparing subgroups of LTx patients presenting or not CNS involvement (n = 26) and (C) specifically with or without nystagmus (n = 24). Survival analysis was assessed by log-rank Mantel-Cox test. Numbers at risk are specified below each panel. When statistically significant, P values are indicated in the figure. CNS, central nervous system; LTx, liver transplant.