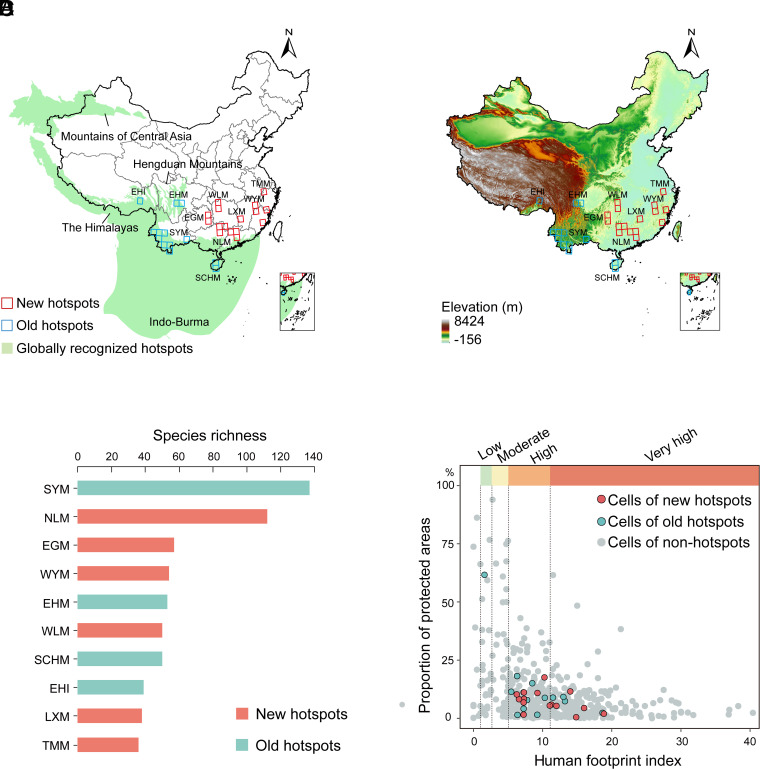
Fig. 3.
Hotspots of Chinese amphibian diversity. (A) The 29 highest-diversity grid cells (upper 95th percentile of species richness, square grid cells). We grouped these 29 grid cells into 10 geographically distinct biodiversity hotspots (orange grid cells): Eastern Himalayas (EHI), Eastern Hengduan Mountains (EHM), Southwest Yunnan Mountains (SYM), South-Central Hainan Mountains (SCHM), Nanling Mountains (NLM), Wuling Mountains (WLM), Eastern Guizhou Mountains (EGM), Luoxiao Mountains (LXM), Wuyi Mountains (WYM), and Tianmu Mountains (TMM). Green regions indicate the four previously recognized global biodiversity hotspots in China (Himalayas, Hengduan Mountains, Indo-Burma, and Mountains of Central Asia). Cells within these four globally recognized hotspots are colored blue and referred to as “old hotspots”, whereas those outside are colored red and referred to as “new hotspots”. The gray lines indicate the provincial boundaries of China. (B) Elevation map of China showing all hotspot grid cells. (C) Total species richness of each hotspot. Abbreviations of hotspots as above. (D) Proportion of protected areas and human footprint index of each grid cell, including grid cells of new hotspots (red), old hotspots (blue), and nonhotspots (gray).

