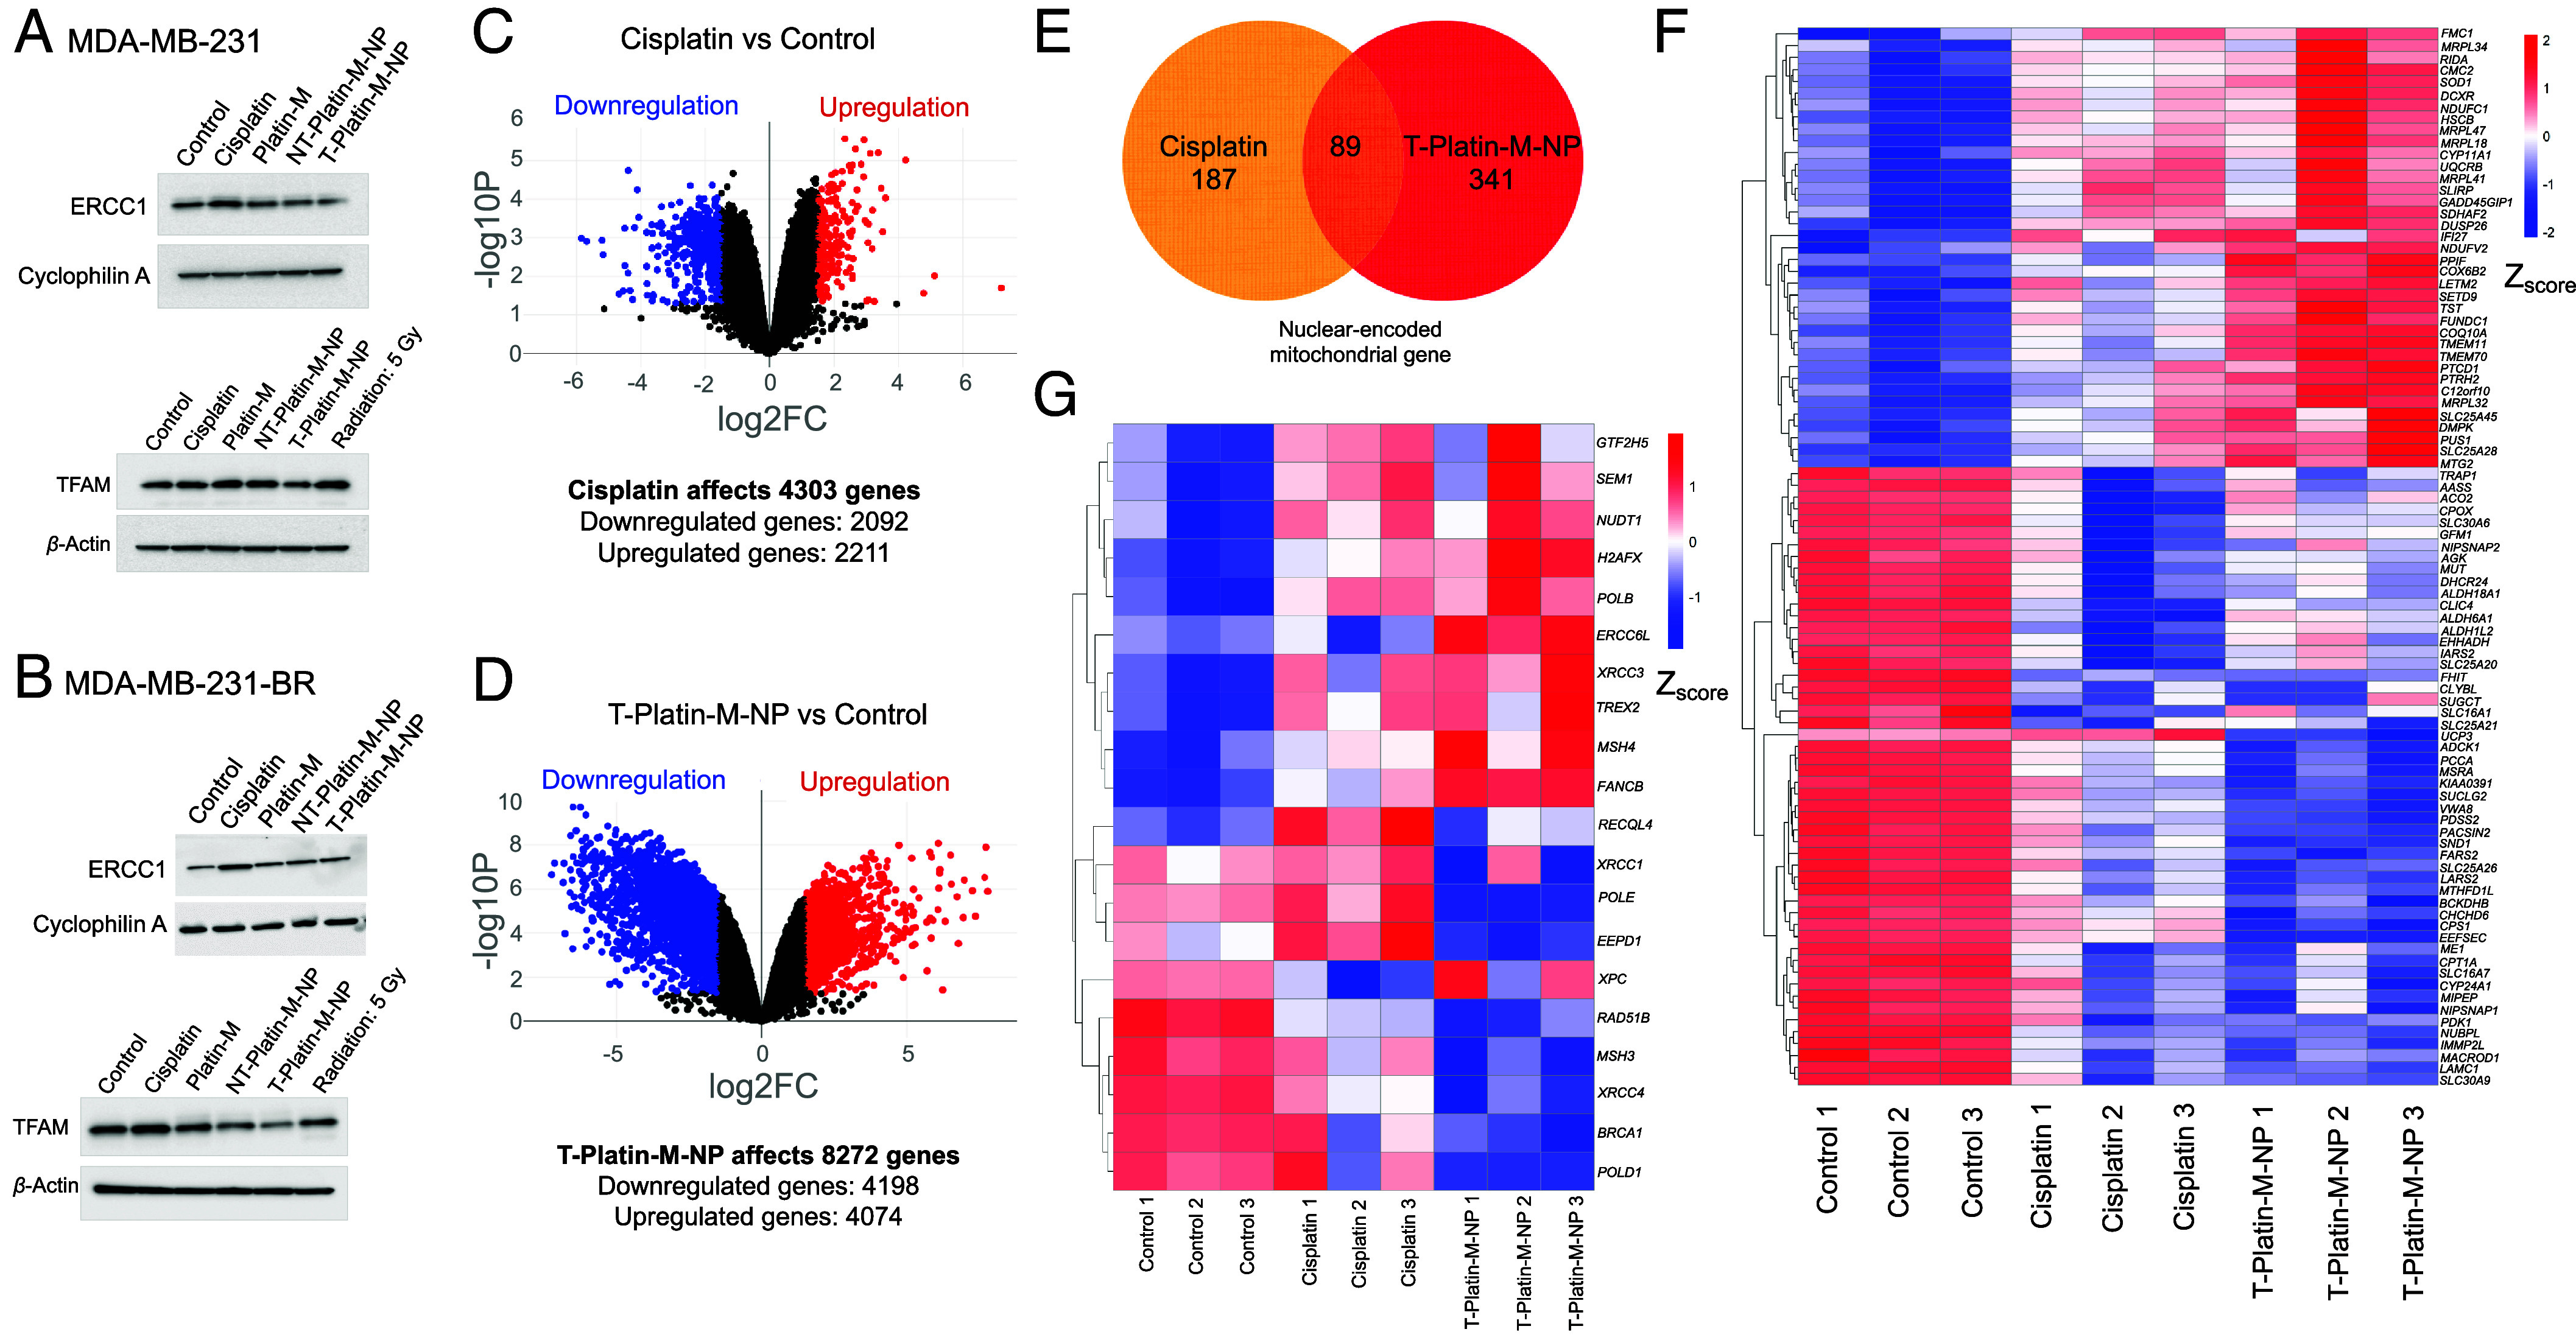
Fig. 2.

Effects of T-Platin-M-NP on whole genome. Western blot analyses in (A) MDA-MB-231 and (B) MDA-MB-231-BR cells showing the effects of treatments on ERCC1 and TFAM expressions. Volcano plots showing the changes in total number of genes when compared between (C) control and cisplatin-treated groups and (D) control and T-Platin-M-NP-treated groups. (E) Venn diagram illustrating the total number of nuclear-encoded mitochondrial genes affected by cisplatin and T-Platin-M-NP treatments. Cisplatin affected 187 genes and T-Platin-M-NP affected 341 genes, out of which 89 genes were common between both the treatments. (F) Gene clustering heatmap showing the differential gene expression of the 89 genes that are common in cisplatin- and T-Platin-M-NP-treated groups. (G) Gene clustering heatmap showing the differential gene expression of the genes involved in the NER pathway after treatments with cisplatin and T-Platin-M-NP in MDA-MB-231-BR cells.
