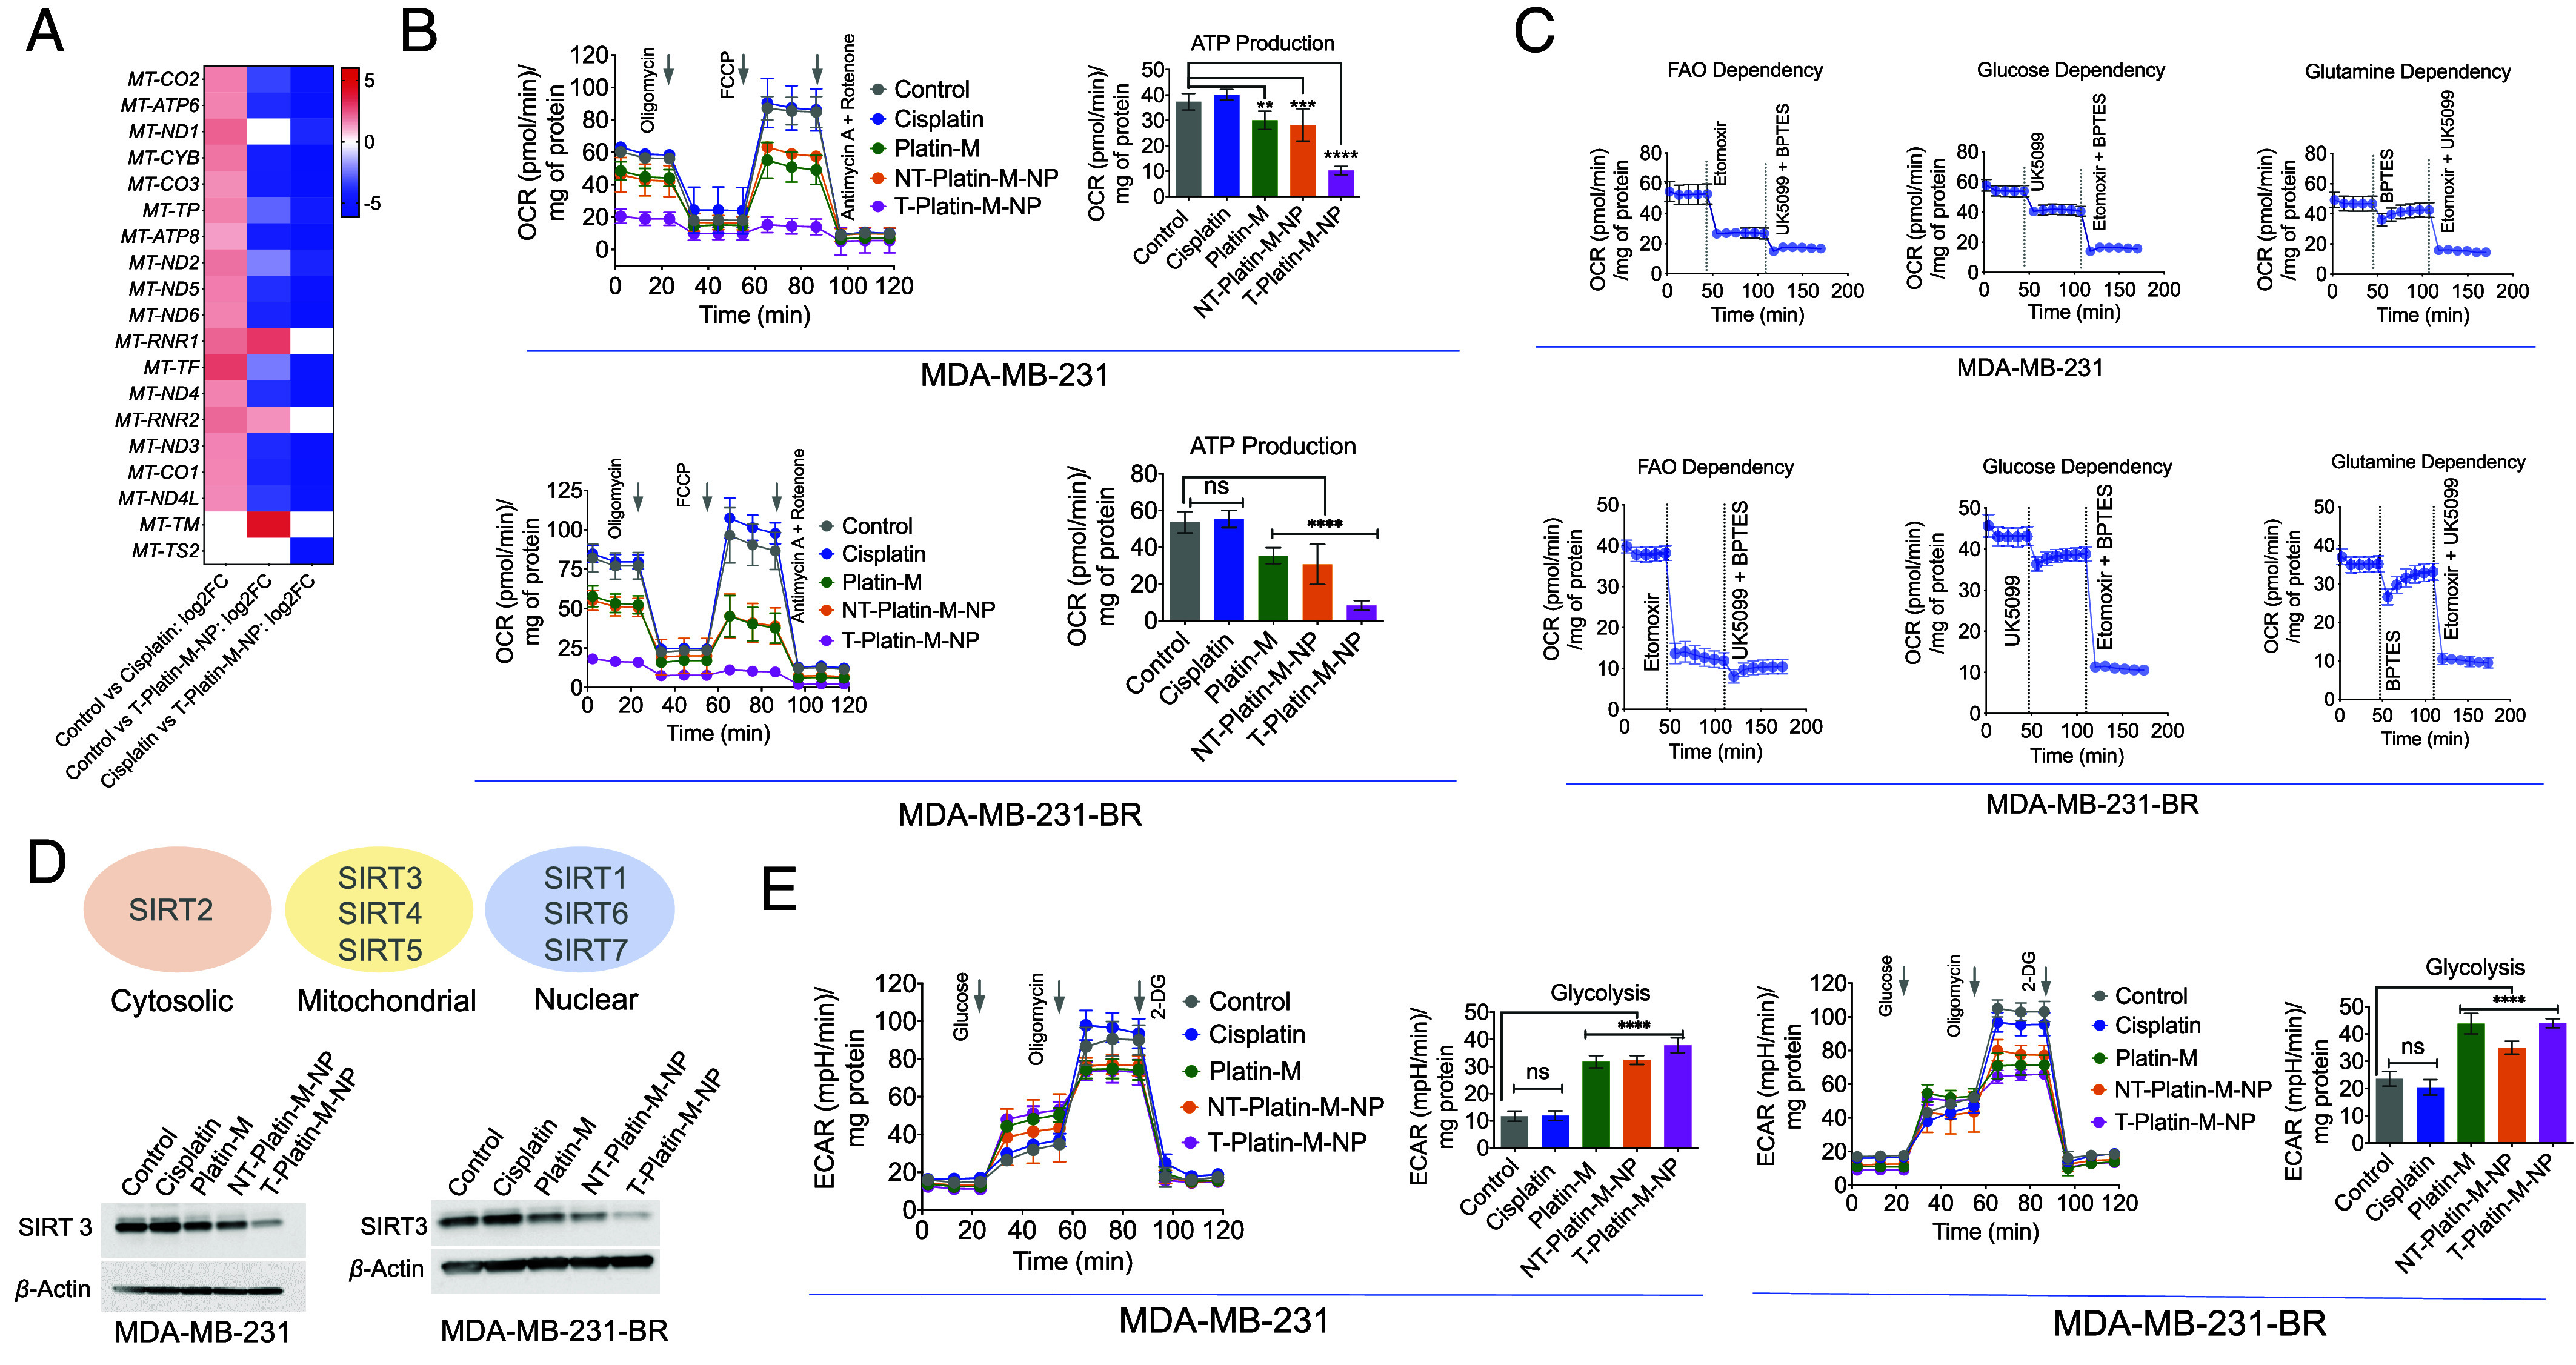
Fig. 3.

Effect of T-Platin-M-NP on the mtDNA and metabolic pathway inhibition. (A) Heatmap showing the differential mitochondrial OXPHOS gene expression based on the log2 fold change in comparison to control and cisplatin; control and T-Platin-M-NP; and cisplatin and T-Platin-M-NP. Cisplatin treatment resulted in upregulation of the mitochondrial gene and T-Platin-M-NP down-regulated the mitochondrial genes. When compared with respect to cisplatin, T-Platin-M-NP treatment showed a downregulation of the mitochondrial genes. (B) Mitostress analyses performed in MDA-MB-231 and MDA-MB-231-BR cells showing significant reduction in ATP production upon treatment with T-Platin-M-NP. (C) Fuel flex analyses showing to understand the dependence of MDA-MB-231 and MDA-MB-231-BR cells on fatty acid oxidation, glucose oxidation, or glutamine oxidation. (D) Western blot analyses in MDA-MB-231 and MDA-MB-231-BR cells showing the change in expression of SIRT3 upon treatment with T-Platin-M-NP. Schematic representation showing the localization of SIRTs 1-7. (E) Glycostress analyses performed in MDA-MB-231 and MDA-MB-231-BR cells showing significant increase in glycolysis upon treatment with Platin-M and T-Platin-M-NPs. Statistical analyses were carried out by a one-way ANOVA with multiple analysis with an alpha value of 0.05.
