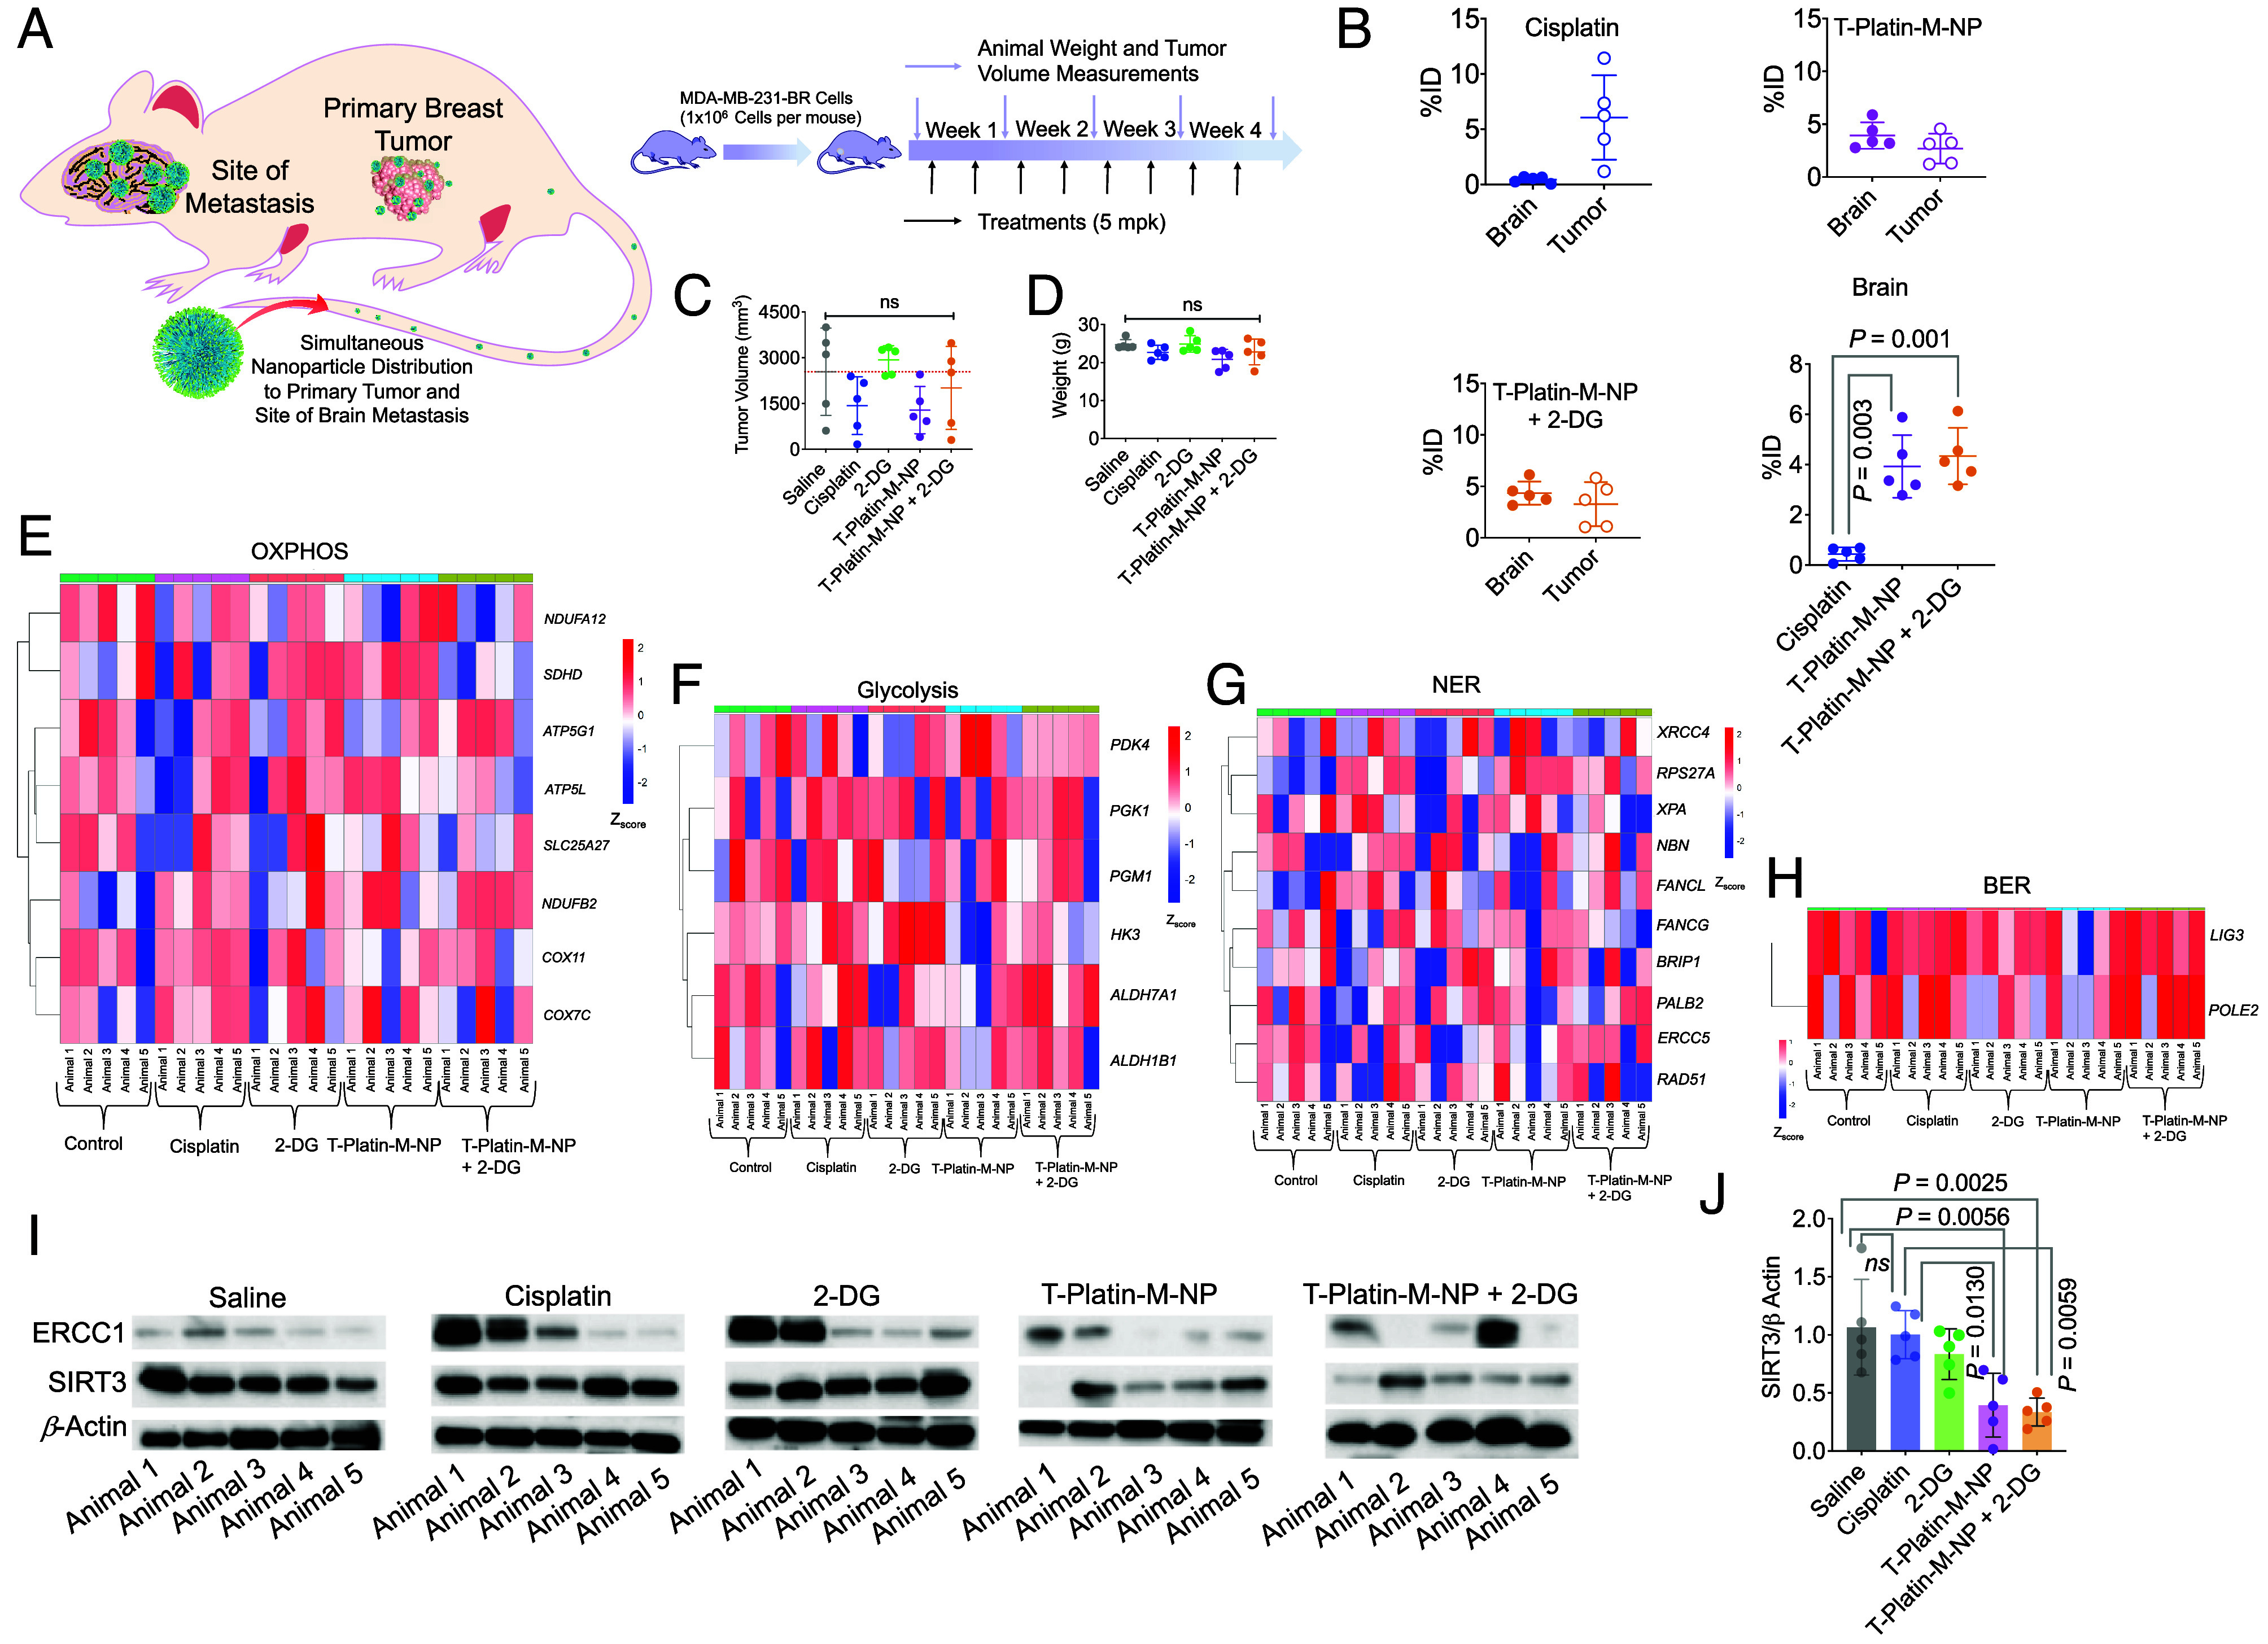
Fig. 4.

Efficacy of T-Platin-M-NP in combination with a glycolysis inhibitor and ability to distribute in primary breast tumor and the site of the brain. (A) Schematic representation showing the experimental design with n = 5 mice per group. (B) Scatter plot showing the percent injected dose (%ID) of cisplatin, T-Platin-M-NP, and T-Platin-M-NP + 2-DG in the brain and primary tumor site following treatment. A comparison in brain distribution between cisplatin, T-Platin-M-NP, and T-Platin-M-NP + 2-DG is also shown. Statistical analyses were carried out using one way ANOVA with multiple comparison. (C) Tumor volume (mm3) and (D) body weight among the different treatment groups. Statistical analysis for (C) and (D) was carried out by one-way ANOVA with an alpha value of 0.05. Gene cluster heatmap showing expression of various genes related to (E) OXPHOS, (F) glycolysis, (G) NER, and (H) BER pathway in tumor samples. (I) Western blot analyses of tumor samples for studying the change in expression of ERCC1 and SIRT3. (J) Quantification of the expression of SIRT3 with respect to β-actin using the western blot. Statistical analysis was carried out by one-way ANOVA with an alpha value of 0.05.
