Fig. 6.

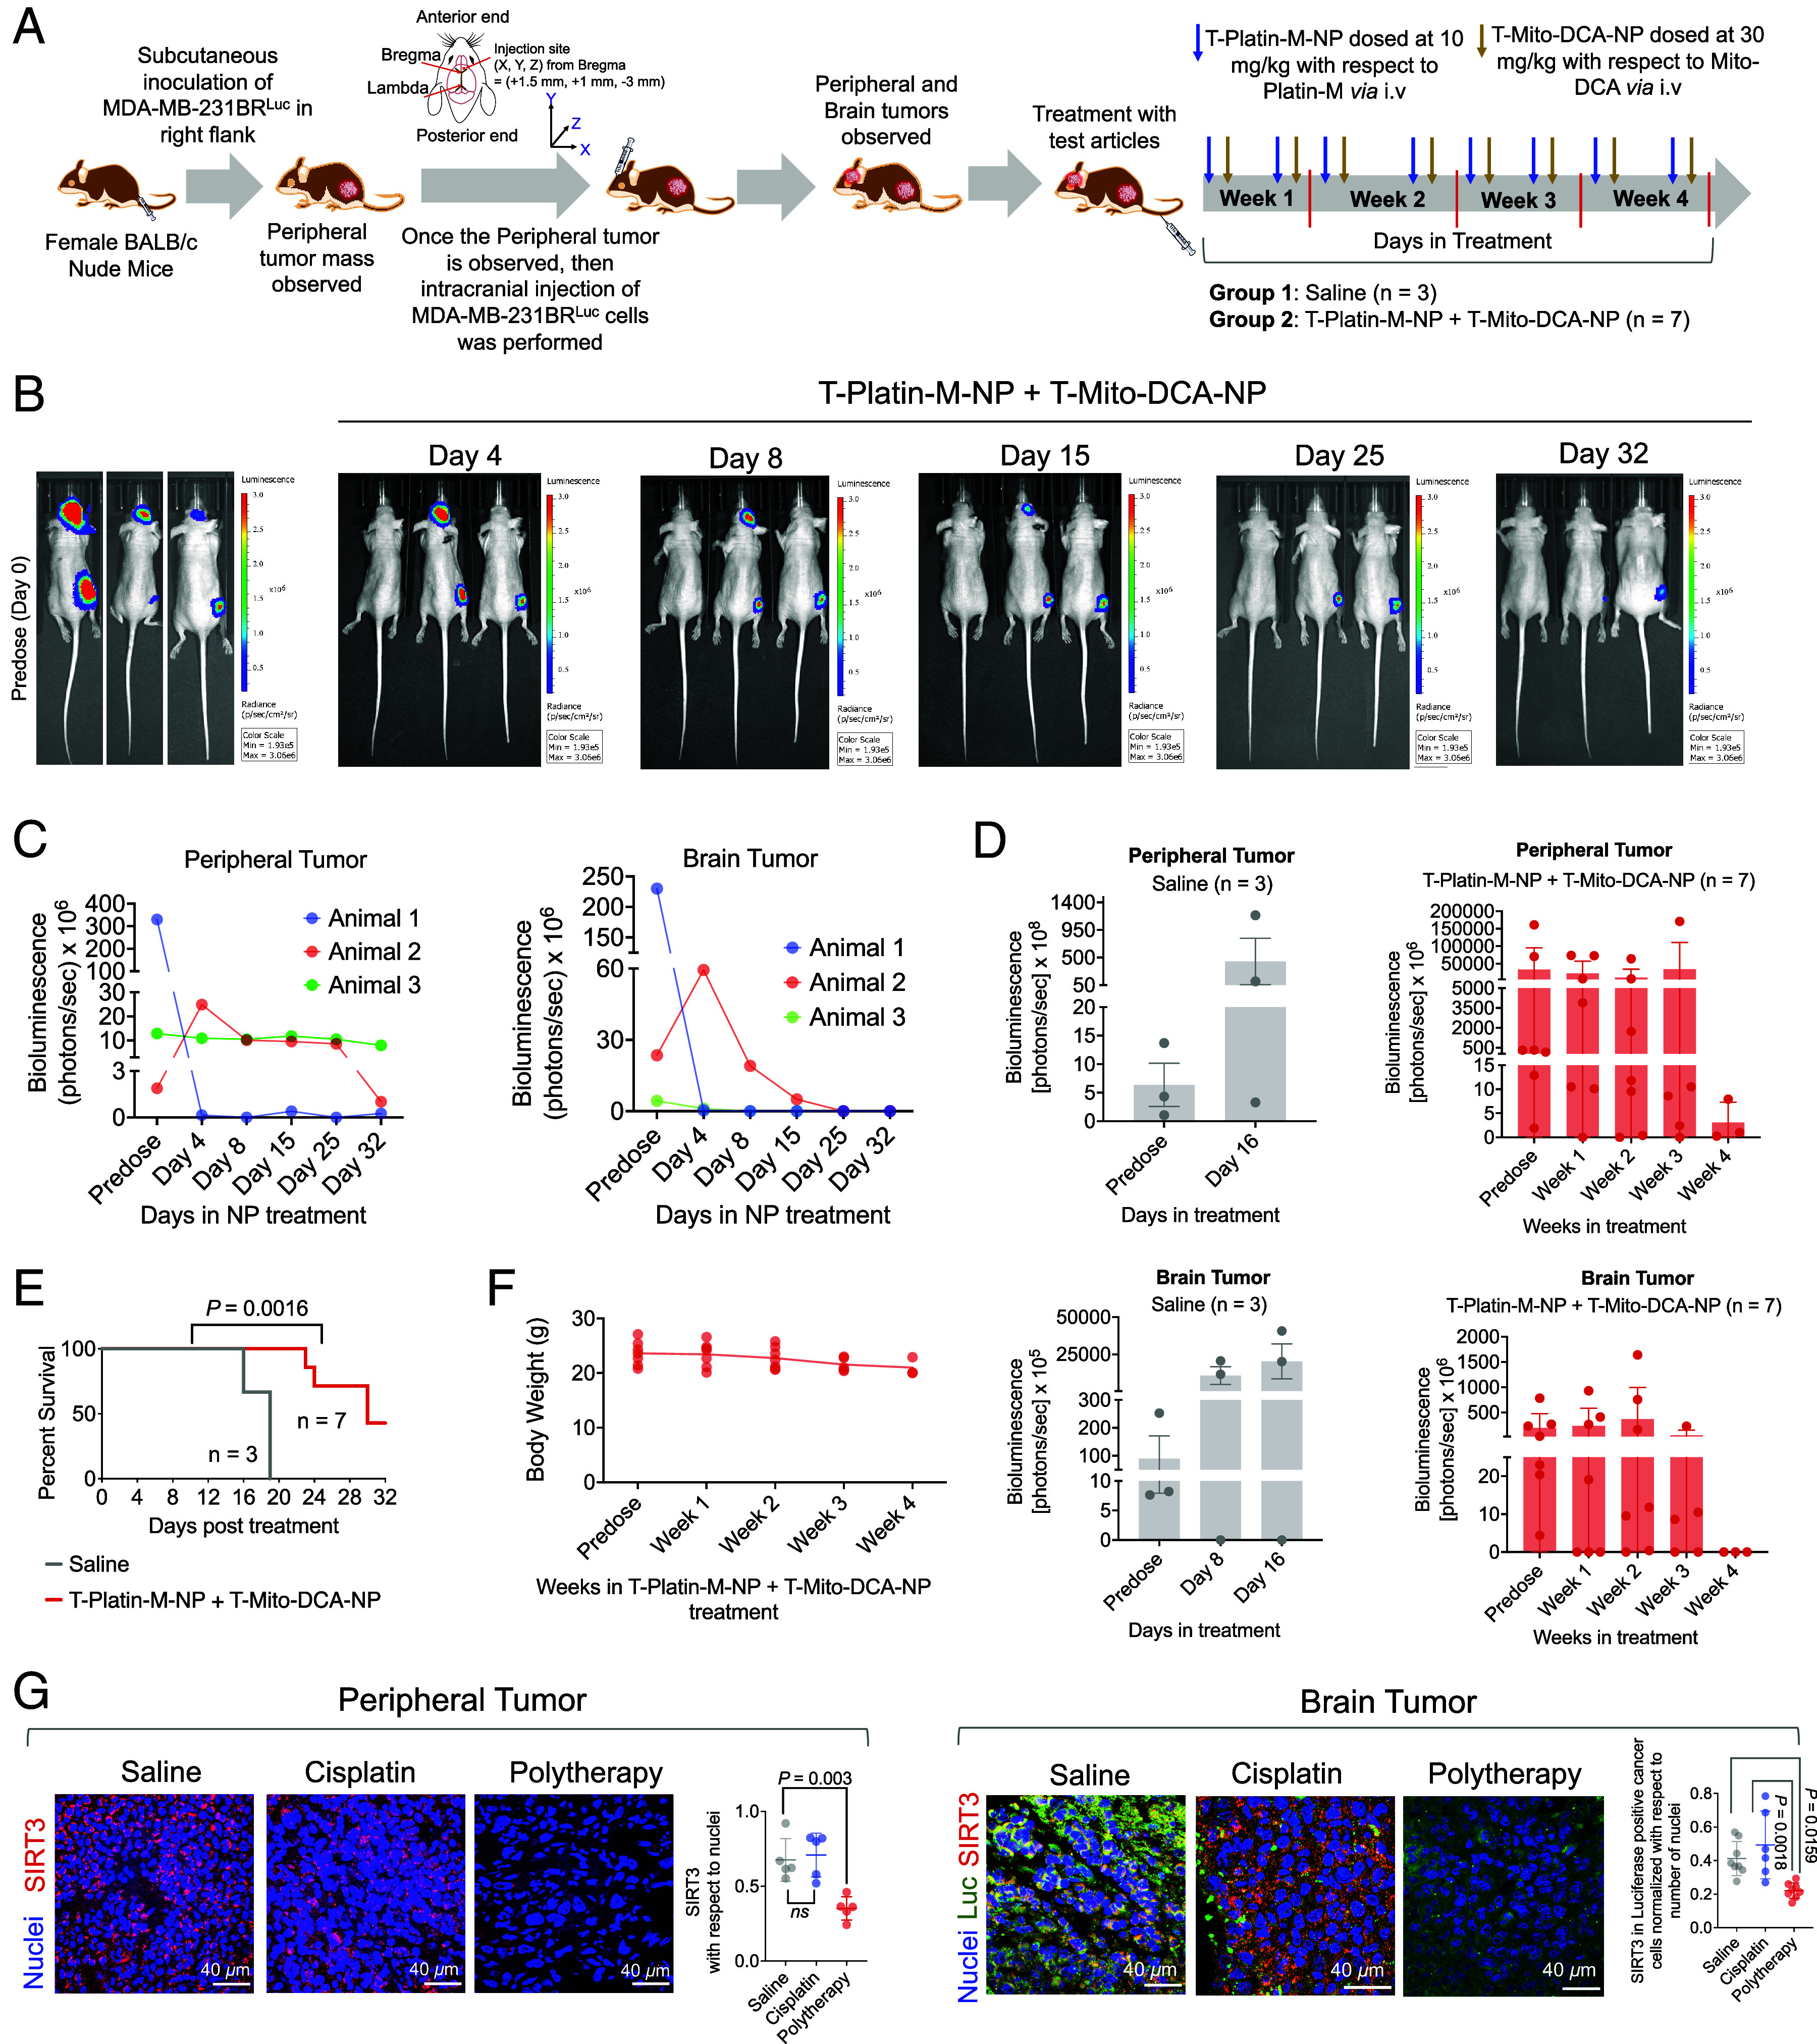
Combinatory effects of T-Platin-M-NP and T-Mito-DCA-NP in a dual tumor model. (A) A schematic diagram of the experimental details. (B) A representative comparison of three animals from the NP-treated group by IVIS imaging predose and at different time points post treatment with NP as well as on the terminal day of the study. (C) Comparison of the primary and secondary tumor volumes in terms of luminescence from those three animals. (D) Tumor volumes of primary breast cancer and secondary brain tumor from saline-treated and combination therapeutic–treated groups using two sets of experiments. (E) Kaplan–Meier analysis of survival comparison between saline and NP-treated groups. The statistical significance was determined by the log-rank (Mantel-Cox) test. (F) Body weight (g) distribution of all animals in the combinatorial NP treated group from predose through all the weeks of treatment regimen. (G) Representative immunofluorescence images illustrating the SIRT3 expression in peripheral tumor and brain tumor sections from saline-, cisplatin-, and polytherapy-treated groups. For the peripheral tumor sections, the relative change of SIRT3 expression was quantified with respect to nuclei. For the brain tumor sections, the mean intensity of SIRT3 was quantified in luciferase positive cancer cells with respect to number of nuclei. Ordinary one-way ANOVA was used to determine the statistical differences between the groups for both peripheral and brain tumor tissues.
