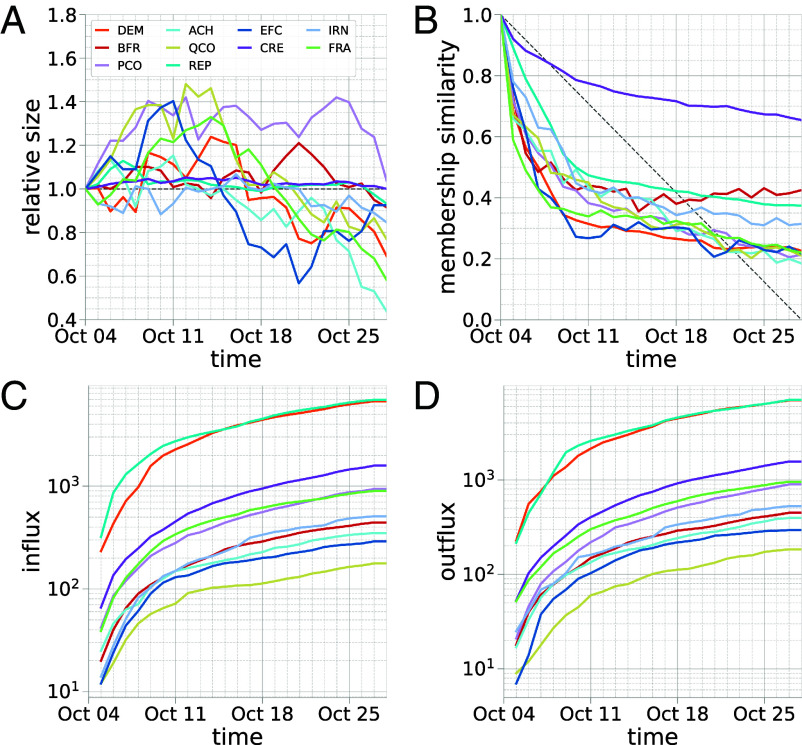
Fig. 4.
USA 2020: Temporal stability of the CCs measured in terms of their evolving size (A), membership (B), and influx (C) and outflux (D) of users to/from the community. Each tick on the x axis corresponds to a 1-wk-long time window. Time windows are offset by 1 d. Dates on the x axis represent the start date of the corresponding time window.

