
FIGURE 2.
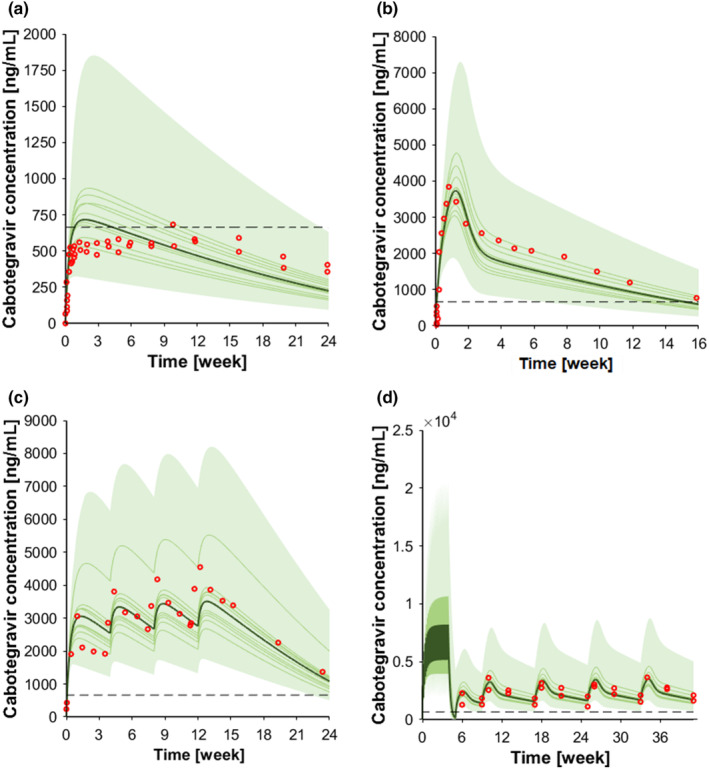
Concentration‐time profile of intramuscular cabotegravir. (a) Cabotegravir 400 mg single dose intramuscular; (b) cabotegravir 800 mg single dose intramuscular; (c) cabotegravir 800 mg single dose intramuscular followed by three 400 mg intramuscular injections, and (d) cabotegravir 30 mg oral at steady‐state followed by 600 mg intramuscular loading dose and by 600 mg intramuscular maintenance doses every other month. The red markers represent clinically observed data for the control scenario. The solid lines, the solid bold line, the shaded area, and the dotted line represent the geometric mean of each virtual trial, the geometric mean of all trials, the 90% normal range of all virtual individuals, and the fourfold protein‐adjusted concentration required for 90% viral inhibition for cabotegravir (664 ng/mL). 56