

Abstract
Ciprofol (HSK3486) is a newly developed, highly selective γ‐aminobutyric acid‐A (GABAA) receptor potentiator that is recently approved for a new indication of sedation for patients in the intensive care unit (ICU) in China. This analysis aimed to characterize the population pharmacokinetics (PopPKs) of ciprofol and evaluate the relationship of exposure with hypotension in mechanically ventilated patients in the ICU. A total of 462 subjects with 3918 concentration measurements from two clinical trials of mechanically ventilated patients in the ICU, four clinical trials of elective surgical patients, and six clinical trials of healthy subjects were used in the PopPK analysis. Exposure–safety relationship for hypotension was evaluated based on the data gathered from 112 subjects in two clinical trials of mechanically ventilated patients in the ICU. Ciprofol pharmacokinetics (PKs) was adequately described by a three‐compartment linear disposition model with first‐order elimination. Body weight, age, sex, blood sampling site (vein vs. arterial), study design (long‐term infusion vs. short‐term infusion), and patient population (ICU vs. non‐ICU) were identified as statistically significant covariates on the PKs of ciprofol. Within the exposure range of the mechanically ventilated ICU patient population, no meaningful association was observed between ciprofol exposure and the incidence of hypotension. These results support the dosing regimen currently used in mechanically ventilated patients in the ICU.
Study Highlights.
WHAT IS THE CURRENT KNOWLEDGE ON THE TOPIC?
Ciprofol is a highly selective GABAA receptor potentiator that is about four to five times more potent than propofol and has fewer adverse events.
WHAT QUESTION DID THIS STUDY ADDRESS?
What are the potential intrinsic and extrinsic covariates that can impact the pharmacokinetics (PKs) of ciprofol? Is the approved ciprofol dose regimen for mechanically ventilated patients in the intensive care unit (ICU) well‐tolerated and safe?
WHAT DOES THIS STUDY ADD TO OUR KNOWLEDGE?
Ciprofol PKs were well‐characterized and generally consistent with other GABAA receptors. No dose adjustments for ciprofol are warranted due to age, body weight, sex, patient population, or study design.
HOW MIGHT THIS CHANGE DRUG DISCOVERY, DEVELOPMENT, AND/OR THERAPEUTICS?
A well‐tolerated safety profile supports the dosing regimen currently used in mechanically ventilated patients in the ICU.
INTRODUCTION
Mechanical ventilation is one of the most commonly used treatment modalities in the intensive care unit (ICU), often causing anxiety, distress, and pain to patients in the ICU. Therefore, mechanically ventilated patients in the ICU are often given sedatives and analgesics to achieve patient comfort and tolerance to the ICU environment. 1 , 2 , 3 Benzodiazepines, propofol, and dexmedetomidine are the most commonly used agents for sedation in mechanically ventilated patients in the ICU. 4 , 5 Benzodiazepines are gamma‐aminobutyric acid (GABA) receptors with favorable cardiovascular risk profiles. It is not yet recommended as a first‐line sedative strategy because it may be associated with the development of delirium and prolonged mechanical ventilation. 5 , 6 Dexmedetomidine is a selective α2‐receptor agonist that induces sedation without significant depression of respiration but has a main side effect of bradycardia. 5 , 6 As with benzodiazepines, propofol acts through GABA receptors. With no bioaccumulation or prolonged sedative effect, propofol is characterized by a fast onset, undergoes rapid metabolism, and a short half‐life. 5 However, propofol should be used with caution because propofol‐associated infusion syndrome can lead to hyperkalemia and cardiac arrest in patients in the ICU after prolonged exposure to propofol infusions, with mortality rates widely reported in the literature of 20% to 80%. 6 , 7 , 8
Ciprofol, a novel 2,6‐disubstituted phenol derivative, is a new intravenous anesthetic agent for the induction and maintenance of anesthesia in clinical practice. 9 , 10 As a structural analog of propofol, ciprofol is a highly selective GABAA receptor potentiator 10 , 11 that is about four to five times more potent than propofol 9 , 10 , 12 and has fewer adverse events (AEs). 13 Ciprofol is approved for sedation and anesthesia during the surgical/procedure of nontracheal intubation, sedation and anesthesia in gynecological outpatient surgeries, induction and maintenance of general anesthesia, and sedation for patients in the intensive care unit in China. 13 , 14 In completed phase II and III clinical trials in mechanically ventilated patients in the ICU, the tolerability, sedation characteristics, and AEs, such as hypotension, were comparable between ciprofol (n = 113) and propofol (n = 57) groups. 15 , 16
A population pharmacokinetic (PopPK) analysis was originally conducted based on four clinical trials of elective surgical patients and five clinical trials of healthy subjects to support PopPK‐pharmacodynamic analysis and exposure–response efficacy and safety analysis for patients undergoing elective surgery. 17 The study design was identified as a statistically significant covariate on the pharmacokinetics (PKs) of ciprofol. Currently, PK data from additional three studies are available. Of these three trials, two completed ICU trials had study designs and patient population different from others. The ciprofol loading dose was 0.1–0.2 mg/kg with a maintenance infusion rate of 0.3 mg/kg/h. Maintenance doses were adjusted according to the Richmond agitation sedation scale (RASS) to maintain the target depth of sedation (−2 ≤ RASS ≤ +1). The range of maintenance doses was 0.06 to 8.0 mg/kg/h. To more accurately characterize PKs and describe the exposure–safety relationship in patients in the ICU, a new PopPK analysis using PK data from the 12 trials was conducted to re‐evaluate the effects of available covariates, especially for the study design on the PKs of ciprofol.
The PopPK characteristics and exposure–safety profile of ciprofol in mechanically ventilated patients in the ICU have not been previously reported. Therefore, the objectives of the current analysis were to characterize the PK of ciprofol, identify the potential impact of intrinsic and extrinsic covariates on the PK of ciprofol, and evaluate the relationship between ciprofol PK exposure and the incidence of hypotension in mechanically ventilated patients in the ICU treated with ciprofol.
METHODS
Study design and patient population
Ciprofol PK data across 12 clinical trials 11 , 15 , 16 , 17 , 18 , 19 , 20 , 21 , 22 were included in the PopPK analysis. Four studies collected only venous blood samples and eight studies had both arterial and venous blood samples. Measurements of ciprofol concentrations in plasma were performed using a validated high‐performance liquid chromatography tandem mass spectrometry assay with a lower limit of quantitation of 5 ng/mL. For the 12 studies involved in the model, the coefficient of variation for precision was less than or equal to 9.2%. The mean accuracy of the quality control samples ranged from 95% to 108% among different studies. Hypertension data from studies HSK3486‐205 and HSK3486‐307 were used to analyze the exposure–safety relationship. A summary of the studies is detailed in Table S1.
All studies were approved by institutional review boards of participating institutions and performed following the Declaration of Helsinki. Written informed consent was obtained from the participants.
PopPK analysis
Ciprofol PK data were analyzed using nonlinear mixed‐effects modeling 23 and implemented with NONMEM version 7.4.3 (ICON Development Solutions) 24 and Perl Speaks NONMEM version 4.2 (Uppsala University, Sweden). 25 , 26
PopPK model development
Based on known PK properties of ciprofol, the default structural model was a three‐compartment disposition model. 17 , 27
Interindividual variability (IIV) in PK parameters was described by an exponential model:
| (1) |
where θ i is the parameter for the ith subject, θ T is natural logarithm of the typical value of the parameter in the population, and η i (ETA) is the random interindividual effect with mean 0 and variance ω 2.
Residual error was described using an additive error model after the log transformation of the PK data:
| (2) |
Where C(t) ij and Ĉ(t) ij represent the logarithm of the jth observed concentration and the model‐predicted concentration for the ith subject, respectively; ε ij is the residual error with mean 0 and variance σ 2.
The covariates tested during PopPK model development are summarized in Table S2. These covariates were selected based on physiological plausibility, clinical relevance, and prior knowledge of similar compounds, as well as the availability of data. Given previously established standard allometric approaches for small‐molecule drugs, 28 , 29 the effects of body weight on clearance and volume terms were first allometrically scaled and incorporated into the base model based on improvements in model fit. After an optimal structural model was identified, the following covariates were examined: age, sex, weight, race (Asian vs. non‐Asian), total bilirubin, alkaline phosphatase, aspartate aminotransferase, alanine aminotransferase, total protein, creatinine clearance, blood sampling site (arterial vs. vein), patient population (ICU vs non‐ICU), and study design (long‐term infusion vs. short‐term infusion). The final PopPK model was determined based on a stepwise forward addition (p < 0.01) and backward deletion (p < 0.001) strategy.
Model evaluation
The final PopPK model was evaluated using goodness‐of‐fit plots, prediction‐corrected visual predictive check (pcVPC), 30 numerical predictive check (NPC), 31 bootstrapping, 32 , 33 and shrinkage assessments. 34
Covariate sensitivity analysis
The covariate sensitivity analysis was performed for the final PopPK model to examine the influence of statistically significant covariates on the model‐predicted exposures, including area under the concentration–time curve from 0 to 24 h (AUC0–24h), peak and trough concentrations during maintenance (C max and C min) after the target dose of a loading dose of 0.1 mg/kg over 4 min, followed by a maintenance dose of 0.30 mg/kg/h for 24 h. Tornado plots were generated based on the percentage differences between simulated exposures and a typical subject.
PopPK model simulations
Target concentration
The RASS is mostly used in the setting of mechanically ventilated patients in the ICU to avoid over‐ and under‐sedation. RASS score within +1 to −2 points suggested that the effects of the sedative treatment are satisfactory. 35 , 36 Therefore, ciprofol concentrations at the timepoint of the RASS measurement were predicted using the Bayesian post hoc individual PK parameters following actual ciprofol dose regimens in studies HSK3486‐205 and HSK3486‐307. The target concentration range was defined as the 90% predicted ciprofol concentration interval (90% PI; between the 5th percentile and 95th percentile) for the RASS range of −2 to +1 during ciprofol administration.
To explore the appropriate dosing regimen to achieve the target concentration for mechanically ventilated patients in the ICU, the model predicted C max were calculated at the end of the induction infusion as well as the end of maintenance dose for different ciprofol treatment regimens: an intravenous loading dose of ciprofol 0.1 mg/kg or 0.2 mg/kg over 0.5, 1, 2, 3, 4, or 5 min, followed by a maintenance dose of 0.06, 0.1, 0.2, 0.3, or 0.8 mg/kg/h for 25 h.
Impact of body weight and age on exposure
In the PK analysis population, age and weight ranged from 18 to 77 years and 41.6 to 97.9 kg, respectively. To further assess the impact of weight and age on ciprofol exposures in mechanically ventilated patients in the ICU, concentration–time profiles were deterministic simulated using the estimated typical PK parameters from the final PopPK model for patients with extreme weight or age values, including the youngest (18 years), the oldest (77 years), underweight (40 kg, lower than the lowest body weight in the PK analysis data), overweight (30 kg/m2, the highest body mass index [BMI] value in the PK analysis dataset), and obese (40 kg/m2) patients. Based on the correlation between the weight and BMI of subjects in this study population, BMI values of 30 and extrapolated 40 kg/m2 correspond to 85 and 116 kg, respectively. The ciprofol infusion was started with a loading dose of 0.1 mg/kg over 4 min, followed by a maintenance dose of 0.30 mg/kg/h for 24 h.
Exposure–safety analysis
The model‐predicted exposure metrics (loading dose [AMTindu], C max during maintenance, average concentration during maintenance [C avg], and the 0–10 h concentration‐time curve under the area [AUC0–10h]) were used for exposure–safety analysis. Specifically, boxplots were generated to show the differences in simulated exposures between safety outcomes. The probability of hypotension was calculated across exposure quantiles to examine the exposure–safety relationship. The relationship between exposure and hypotension was analyzed using a logistic regression model with R version 3.5.1.
RESULTS
PopPK analysis dataset
Baseline characteristics for all subjects included in this analysis are summarized in Table 1. The PK analysis dataset included 3916 ciprofol concentrations from 462 subjects. Observations below the lower limit of quantitation, constituting 5.59% (232/4148) of the data points, were not included in the analysis. Ciprofol plasma concentrations versus time stratified by study in the PopPK model development dataset are shown in Figure S1.
TABLE 1.
Baseline population characteristics in the analysis datasets.
| Item (unit) | All subjects | Non‐ICU subjects | ICU subjects |
|---|---|---|---|
| N | 462 | 350 | 112 |
| PK samples | 3918 | 3457 | 461 |
| Continuous variable (median [minimum, maximum]) | |||
| Age (years) | 38.0 (18.0, 77.0) | 32.0 (18.0, 64.0) | 57.0 (19.0, 77.0) |
| Body weight (kg) | 61.7 (41.6, 97.9) | 61.4 (41.6, 97.9) | 63.5 (42.0, 90.0) |
| Height (cm) | 165 (144, 194) | 165 (148, 194) | 165 (144, 181) |
| BMI kg/m2) a | 22.9 (16.9, 30.0) | 22.7 (17.8, 30.0) | 23.3 (16.9, 29.4) |
| Aspartate aminotransferase (U/L) | 21.0 (7.00, 408) | 20.0 (7.00, 115) | 25.4 (8.20, 408) |
| Alanine aminotransferase (U/L) | 19.0 (3.00, 416) | 18.0 (3.00, 95.0) | 21.0 (6.00, 416) |
| Total bilirubin (μmol/L) | 11.0 (3.00, 197) | 10.7 (3.00, 37.0) | 13.0 (3.80, 197) |
| Creatinine clearance (mL/min) b | 110 (44.4, 212) | 115 (46.4, 201) | 96.8 (44.4, 212) |
| Total protein (g/L) | 70.6 (31.5, 87.9) | 72.1 (54.5, 87.9) | 55.8 (31.5, 78.4) |
| Categorical variable (category, N) | |||
| Sex | |||
| Male | 226 (48.92%) | 158 (45.14%) | 68 (60.71%) |
| Female | 236 (51.08%) | 192 (54.86%) | 44 (39.29%) |
| Race | |||
| Asian | 394 (85.28%) | 282 (80.57%) | 112 (100.00%) |
| Non‐Asian | 68 (14.72%) | 68 (19.43%) | — |
| Subject status | |||
| Healthy volunteer | 125 (27.06%) | 125 (35.71%) | — |
| Elective surgical patients | 225 (48.70%) | 225 (64.29%) | — |
| ICU patients | 112 (24.24%) | — | 112 (100%) |
| Sampling site | |||
| Vein | 230 (49.78%) | 227 (64.86%) | 3 (2.679%) |
| Arterial | 146 (31.60%) | 41 (11.71%) | 105 (93.75%) |
| Vein + Arterial | 86 (18.61%) | 82 (23.43%) | 4 (3.571%) |
Note: All subjects were used for PK analysis, including ICU and non‐ICU subjects; ICU subjects were used for exposure–safety analysis.
Abbreviations: BMI, body mass index; ICU, intensive care unit; PK, pharmacokinetics; N, Number of subjects.
BMI is calculated as follows: Body weight [kg/Height (m2)].
Creatinine clearance is calculated as follows: (140 – Age [year]) × Body weight [kg]/(72 × Creatinine [μmol/L]/88.4) × 0.85 (if female subject).
PopPK analysis
Final PopPK results
Ciprofol PK following intravenous administration of ciprofol was well‐described by a three‐compartment linear disposition model with first‐order elimination. The PopPK model was parameterized in terms of central compartment clearance (CL), central compartment volume of distribution (V 1), atrioventricular clearance between the central compartment and deep, shallow peripheral compartments (Q 2 and Q 3), and deep, shallow peripheral compartmental volumes of distribution (V 2 and V 3), as illustrated in Figure S2.
Body weight, age, sex, blood sampling site, patient population, and study design were identified as significant covariates (Figure 1). The parameter–covariate relations in the final model are described below:
| (3) |
where FLG = 0 and ICU = 0 for long‐term infusion in ICU; FLG = 0 and ICU = 1 for long‐term infusion in non‐ICU; and FLG = 1 and ICU = 1 for short‐term infusion in non‐ICU.
FIGURE 1.
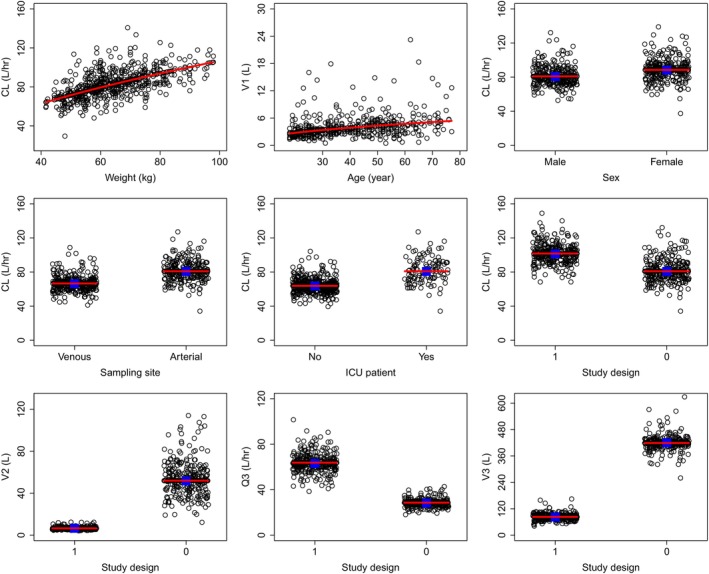
Ciprofol PK parameter–covariate relationships. Circles are the empirical Bayes estimates of individual PK parameters after correcting for all other covariates except for the one plotted in the x‐axis. Blue squares represent the geometric mean within the group for categorical covariates. Red lines represent the typical (population) predicted parameter–covariate relationship based on the model. The model‐estimated shrinkages on CL, V 1, Q 2, V 2, Q 3, and V 3 were 24.7%, 30.9%, 40.5%, 43.4%, 49.0%, and 50.3%, respectively. CL, clearance from the central compartment; PK, pharmacokinetic; Q3, atrioventricular clearance between the central compartment and shallow peripheral compartment; V 1, central compartment volume of distribution; V 2 and V 3, deep and shallow peripheral compartmental volumes of distribution; Study design, 0 for long‐term infusion, 1 for short‐term infusion.
The PK model development process is summarized in Table S3. The estimated final PK model parameters are presented in Table 2 and all parameters were precisely estimated (relative standard error [RSE] values <9%). The model‐estimated typical CL was 80.9 L/h, V 1 was 3.53 L, Q 2 was 73.9 L/h, V 2 was 51.9 L, Q 3 was 28.6 L/h, and V 3 was 419 L. IIVs on CL, V 1, Q 2, V 2, Q 3, and V 3 were 19.1%, 75.0%, 50.9%, 44.9%, 25.8%, and 29.0%, respectively. The corresponding shrinkages were 24.7%, 30.9%, 40.5%, 43.4%, 49.0%, and 50.3%, respectively.
TABLE 2.
PopPK parameters of ciprofol and bootstrap results.
| Parameter | Population model estimates (%RSE) [95% CI] | Bootstrapping Median (95% CI) |
|---|---|---|
| Fixed effect parameters | ||
| CL (L/h) | 80.9 (3.33) [75.8–86.4] | 81.2 (75.9–85.8) |
| V 1 (L) | 3.53 (5.71) [3.16–3.95] | 3.52 (3.13–4.21) |
| Q 2 (L/h) | 73.9 (5.45) [66.4–82.2] | 73.1 (65.0–82.4) |
| V 2 (L) | 51.9 (7.49) [44.8–60.1] | 51.4 (43.8–59.3) |
| Q 3 (L/h) | 28.6 (5.33) [25.7–31.7] | 28.7 (25.7–32.2) |
| V 3 (L) | 419 (8.70) [353–497] | 421 (359–519) |
| Impact of body weight on CL | 0.578 (11.7) [0.445–0.711] | 0.58 (0.43–0.721) |
| Impact of age on V 1 | 0.496 (25.7) [0.246–0.746] | 0.524 (0.221–0.864) |
| Impact of sampling site (vein) on CL | 0.823 (2.44) [0.785–0.863] | 0.821 (0.783–0.864) |
| Impact of gender (female) on CL | 1.09 (2.52) [1.04–1.15] | 1.09 (1.04–1.15) |
| Impact of ICU on CL a | 0.789 (4.36) [0.724–0.859] | 0.789 (0.722–0.855) |
| Impact of FLG on CL a | 1.26 (3.18) [1.18–1.34] | 1.26 (1.18–1.34) |
| Impact of FLG on V 2 a | 0.125 (8.59) [0.106–0.148] | 0.126 (0.107–0.152) |
| Impact of FLG on Q 3 a | 2.23 (6.35) [1.97–2.52] | 2.21 (1.94–2.53) |
| Impact of FLG on V 3 a | 0.198 (9.62) [0.164–0.24] | 0.196 (0.157–0.238) |
| Interindividual variability (%) | ||
| CL | 19.1 (8.59) [15.6–22.1] | 18.9 (16.2–22.8) |
| V 1 | 75.0 (9.37) [59.6–87.7] | 73.8 (57.2–88.4) |
| Q 2 | 50.9 (9.03) [40.9–59.2] | 49.0 (38.4–58.9) |
| V 2 | 44.9 (10.8) [34–53.6] | 42.9 (30.9–53.3) |
| Q 3 | 25.8 (13.7) [17.6–32.0] | 26.0 (18.9–33.7) |
| V 3 | 29.0 (10.2) [22.5–34.4] | 28.4 (22.7–34.9) |
| Residual variability | ||
| Proportional residual of sampling from vein (%) | 31.9 (5.33) [28.3–35] | 32.2 (28.9–35.5) |
| Proportional residual of sampling from arterial (%) | 21.8 (7.77) [18.2–24.9] | 21.8 (18.8–25.8) |
Note: Non‐ICU patient with long‐term infusion: FLG = 0 and ICU = 1 for HSK3486‐102, HSK3486‐204, and HSK3486‐306. Non‐ICU patient with short‐term infusion: FLG = 1 and ICU = 1 for other studies.
Abbreviations: CI, confidence interval; CL, clearance; FLG, flag of study; PopPK, population pharmacokinetic; RSE, relative standard error; ICU, intensive care unit; Q 2, intercompartment clearance between the central compartment and peripheral compartment 1; Q 3, between central compartment and peripheral compartment 2; V 1, volume distribution of central volume; V 2, volume distribution of peripheral compartment 1; V 3, volume distribution of peripheral compartment 2.
ICU patient with long‐term infusion: FLG = 0 and ICU = 0 for HSK3486‐205 and HSK3486‐307.
Based on the final PK model estimates, a 10‐kg increase in body weight resulted in a 9.02% increase in CL and a 10‐year increase in age resulted in a 14.0% increase in V 1. Women exhibited 9.31% lower CL compared to men. Subjects taking blood samples from veins exhibited 17.7% lower CL than subjects taking blood samples from the arteries, reflecting a mild impact of the sampling site on the PK of ciprofol which are consistent with what was previously reported. 37 , 38 The model estimated CL values were 21.1% lower and 35.1% lower, respectively in long‐term infusion in non‐ICU and short‐term infusion in non‐ICU than in long‐term infusion in ICU.
The final model well‐described the observed plasma ciprofol concentrations following intravenous administration across 12 studies included in the analysis. Goodness‐of‐fit plots indicated a satisfactory agreement between predicted and observed concentrations of ciprofol, with no discernible bias observed in the residual plots across time and predicted concentrations (Figure S3). Both pcVPC plots (Figures 2 and S4) and NPC results (data not shown) demonstrated that the final model effectively captures the central tendency of ciprofol plasma concentration distribution as well as IIV. Bootstrap results further confirmed the stability of the final model (Table 2).
FIGURE 2.
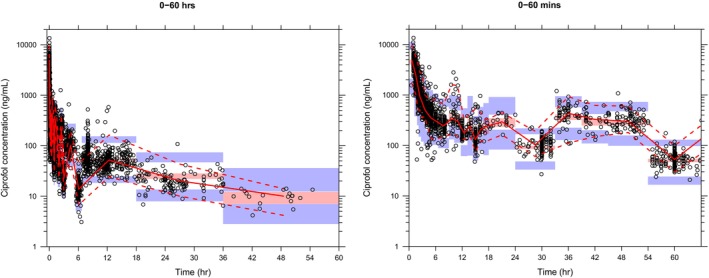
The pcVPC of ciprofol plasma concentration–time profiles across all studies. Blue circles are individual observed concentrations, solid red lines represent the median observed concentrations and dashed red lines represent the 2.5th and 97.5th percentiles of the observed concentrations over time. Pink‐shaded areas represent the 95% CI of the predicted median concentrations, and purple‐shaded areas represent the 95% CI of the predicted 2.5th and 97.5th percentiles of the concentrations over time. CI, confidence interval; pcVPC, prediction‐corrected visual predictive check.
Covariate sensitivity analysis
The covariate sensitivity analysis showed that body weight was the most influential covariate on ciprofol exposure (Figure S5). Compared with a typical patient with body weight of 62 kg, patients with body weight at the 10th and 90th percentiles were expected to have 13.4% to 20.2% higher and 11.8% to 16.8% lower AUC steady‐state (AUCss) and C max,ss, respectively. The impact of patient population (ICU vs. non‐ICU) on ciprofol CL resulted in 20.9% higher AUC0‐24h and 8.97% higher C max in non‐ICU patients compared with patients in the ICU. Patients' PK samples taken from veins were expected to have 16.9% higher AUC0‐24h and 7.43% higher C max compared to patients' PK samples taken from arteries. Baseline age and sex are not expected to have clinically meaningful effects on ciprofol exposure in patients after a long‐term infusion of ciprofol (<7.1%). The differences in ciprofol exposure resulting from these significant covariates are within the overall variation in exposure in the long‐term infusion patient population (Figure S5).
PopPK model simulations
Target concentration interval
The model predicted plasma concentration ranges corresponding to different RASS values are shown in Figure 3. For mechanically ventilated patients in the ICU in studies HSK3486‐205 and HSK3486‐307, the target concentration range (90% PI) corresponding to the desired level of sedation (RASS score − 2 to +1) was 77.0 to 215.6 ng/mL.
FIGURE 3.
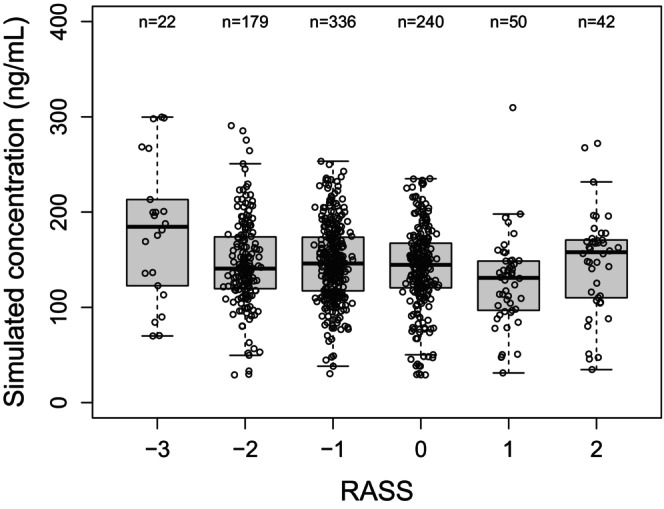
Simulated concentrations versus RASS score. Circles are the model predicted plasma concentration ranges corresponding to different RASS values in individual mechanically ventilated ICU patients. The boxes represent the 25th to 75th percentiles (the interquartile range). The solid black horizontal line in the middle of each box represents the median. The whiskers represent the range of data points within 1.5 times the interquartile range. ICU, intensive care unit; RASS, Richmond agitation sedation scale.
A variety of dosing regimens was evaluated and a few simulation results are shown in Figure 4 (a loading dose of 0.1 mg/kg over 0.5, 1, 2, 3, 4, or 5 min, followed by a maintenance dose of 0.3 mg/kg/h) and Figure 5 (a loading dose of 0.1 mg/kg over 4 min, followed by a maintenance dose of 0.06, 0.1, 0.2, 0.3, or 0.8 mg/kg/h). For a loading dose of 0.1 mg/kg, the model‐predicted C max at the end of the loading dose infusion was 464 ng/mL. The model‐predicted C max values at the end of the maintenance dose infusion were 41.6, 69.1, 138, 207, and 550 ng/mL for the maintenance doses of 0.06, 0.1, 0.2, 0.3, or 0.8 mg/kg/h, respectively. For a loading dose of 0.2 mg/kg, the model‐predicted C max at the end of the loading dose infusion was 928 ng/mL. The model‐predicted C max values at the end of the maintenance dose infusion were 41.9, 69.4, 138, 207, and 551 ng/mL for the maintenance doses of 0.06, 0.1, 0.2, 0.3, or 0.8 mg/kg/h, respectively. In addition, the model predicted concentrations at the end of the loading dose infusion decreased with increasing loading dose infusion time (Table S4).
FIGURE 4.
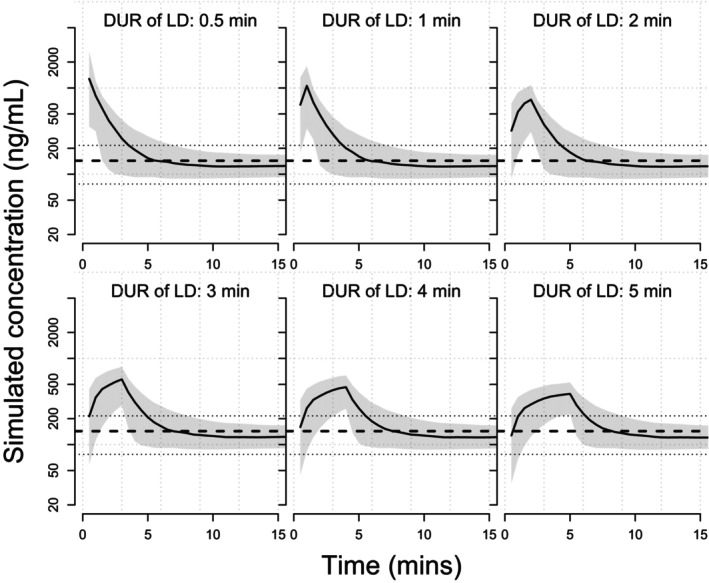
Simulated concentration‐time profiles for a loading dose of 0.1 mg/kg over 0.5–5 mins followed by a maintenance dose of 0.3 mg/kg/h. Solid blue lines represent the simulated concentration‐time profile of individual subjects. The solid red line represents the median of the target concentration (143.3 ng/mL) and the dashed red lines represent the 5th and 95th percentiles of the target concentrations (77.0–215.6 ng/mL). DUR, infusion duration; LD, loading dose; min, minute.
FIGURE 5.
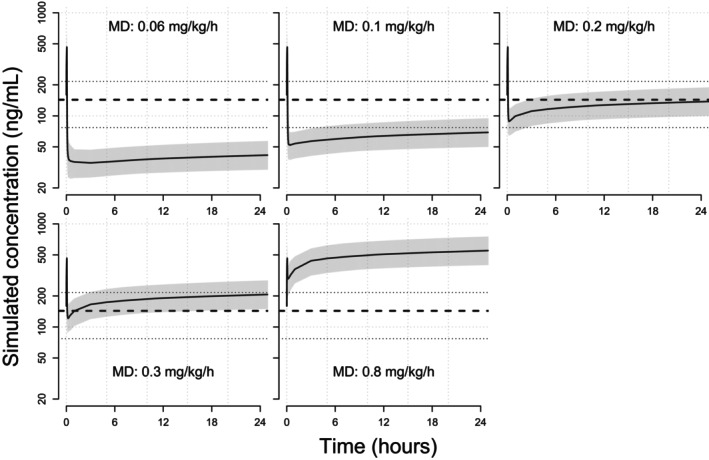
Simulated concentration‐time profiles for a loading dose of 0.1 mg/kg over 4 min followed by maintenance doses of 0.06–0.3 mg/kg/h. Solid blue lines represent the simulated concentration‐time profile of individual subjects. The solid red line represents the median of the target concentration (143.3 ng/mL) and the dashed red lines represent the 5th and 95th percentiles of the target concentrations (77.0–215.6 ng/mL). MD, maintenance dose.
Impact of body weight and age on exposure
The simulated concentration‐time profiles for different body weights and ages are shown in Figure S6. Predicted AUC0–24h and C max were 4606 ng*h/mL and 500.3 ng/mL, respectively for a typical 33‐year‐old patient with a body weight of 62 kg. Predicted AUC0–24h in the youngest, the oldest, underweight, overweight, and obese patients were 4608, 4602, 3638, 5424, and 6345 ng*h/mL, respectively. Predicted C max in the youngest, the oldest, underweight, overweight, and obese patients were 513.7, 461.0, 353.6, 635.3, and 796.5 ng/mL, respectively.
Exposure–safety analysis
Out of 112 mechanically ventilated patients in the ICU, 19 patients developed hypotension in studies HSK3486‐205 and HSK3486‐307. The summary of exposure stratified by quartile in the safety analysis dataset is shown in Table S5. The boxplots (Figure S7) showed similar AMTindu and C max distributions in mechanically ventilated patients in the ICU with and without hypotension, but a slightly lower AUC0‐10h/Cavg in patients with hypotension. The probability of hypotension plots stratified by quantiles of ciprofol exposures showed no clinically relevant differences across quantiles of AMTindu, C max, C avg, and AUC0–10h (Figure S8). Further logistic regression showed no clinically meaningful relationship between ciprofol exposure and the incidence of hypotension (data not shown).
DISCUSSION
Sedation and analgesia are important components of care for mechanically ventilated patients in the ICU. 39 Despite the generally favorable properties of propofol as a sedative, propofol infusion syndrome can limit its clinical application. 12 Ciprofol is about five times more potent than propofol, 12 suggesting it can achieve the same sedative and anesthetic effects as propofol at lower doses. Therefore, ciprofol holds promise for intravenous induction of general anesthesia and patient sedation. The current analysis confirms that ciprofol is comparable to propofol and the selected dosing regimen is well‐tolerated and sedative, supporting the current dosing regimen for mechanically ventilated patients in the ICU.
As a structural analog of propofol, the PK properties of ciprofol are virtually similar to those of propofol. 13 Many PK models for propofol have been published and the most recently published unified PK model for propofol is a three‐compartment model. 37 In this analysis, PK data across 12 clinical studies were adequately characterized by a three‐compartment linear disposition model with first‐order elimination following intravenous administration, which are consistent with those reported previously. 17 , 27
In the final PopPK model, all the typical values of PK parameters were precisely estimated (RSE% < 9%), and the values were consistent with a typical GABAA receptor. 38 IIV on PK parameters fell within typical ranges for GABAA receptors. The η‐shrinkage for CL was 24.7%, suggesting their empirical Bayes estimates could be used to accurately describe the relationships between these parameters and the relevant covariates. The V 1, Q 2, Q 3, and V 3 had relatively higher η‐shrinkage (30.9%–50.3%), which may cause individual estimates to be closer to the population estimate. 34 The estimated residual errors were relatively low and well estimated (RSE% < 8%). The ε‐shrinkage for the residual errors was also relatively low (16.4% for veins and 17.7% for arteries).
The most common covariates in previously reported propofol PK models were body weight, age, sex, sampling site, and method of administration (bolus vs. continuous infusion). 38 Significant covariates included in the current PK model were body weight, age, sex, blood sampling site, patient population, and study design, which are consistent with those reported previously, except for patient population. Body weight, sex, and sampling site were identified as significant covariates on CL. Age was identified as a significant covariate on V 1 and the study design was identified as a significant covariate on CL, V 2, Q 3, and V 3. However, the covariate sensitivity analysis showed that the magnitude of the effect of these significant covariates on ciprofol exposure (AUC0–24h and C max) was relatively small (<21%; Figure S5) compared with the overall variability of exposure in the long‐term infusion patient population and not considered clinically meaningful.
It was reported that the V 1 and half‐life of propofol increased in long‐term infusion compared to short‐term infusion. 40 Owing to inherent lipophilicity, ciprofol might be more distributed into adipose tissues over time, resulting in PK parameter changes after a long‐term infusion. Compared to the previously reported population PK analysis, 17 patient population (ICU vs. non‐ICU) was identified as a new significant covariate because the previous analysis did not include any samples from patients in the ICU. Compared with patients in the ICU, non‐ICU patients had 20.9% and 8.97% higher AUC0–24h and C max, respectively. non‐ICU patients exhibited lower CL compared to patients in the ICU. It is currently unknown what contributed to lower ciprofol exposure in patients in the ICU relative to exposure in non‐ICU patients. Compared with non‐ICU patients, patients in the ICU were older, more likely to have underlying comorbidities, and have more severe laboratory abnormalities. In this study, the median age of non‐ICU patients was 32 years, whereas the median age of patients in the ICU was 57 years. Alternatively, this may be due in part to the higher PK variability in elderly patients with comorbidities, who often receive multiple concomitant medications. Additionally, augmented renal clearance 41 might also be a possible reason to explain the decreased exposure. As propofol, ciprofol is mainly metabolized by UGT1A9 and CYP2B6, both of which are expressed not only in liver but also in kidneys. The propofol glucuronidation by kidney microsomes is three to four times higher than that of liver microsomes, 42 demonstrating the role of renal metabolism for this type of structure. For renal cleared drugs, such as vancomycin or aminoglycosides, decreased exposure in the critically ill population have already been reported in various studies. 43 Ciprofol is metabolized in the liver and excreted primarily through the urine. Renal function measure (creatinine clearance) and hepatic function measures (aspartate aminotransferase, alanine aminotransferase, alkaline phosphate, total bilirubin, and total protein) were tested during PopPK covariate model development and were not identified as significant covariates for ciprofol CL. Previous studies 21 , 27 , 44 have shown that patients with mild and moderate renal or hepatic impairment generally do not require dose adjustment, and the current analysis further confirms this.
In the PK analysis population, age and weight ranged from 18 to 77 years and 41.6 to 97.9 kg, respectively. Additional simulations were also performed for patients with extreme weight or age values, including the youngest (18 years), the oldest (77 years), underweight (40 kg, lower than the lowest body weight in the PK analysis data), overweight (30 kg/m2, the highest BMI value in the PK analysis dataset, 85 kg), and obese (40 kg/m2, 116 kg) patients. Compared with a typical patient with a body weight of 62 kg, the simulated AUC0–24h and C max in underweight, overweight, or obese patients were up to 29.3% lower, 27.0% higher, and 59.2% higher, respectively. The simulated AUC0–24h and C max in the youngest and the oldest patients were up to 2.67% higher and 7.86% lower, respectively compared with a typical 33‐year‐old patient.
These PopPK simulation results suggest that variations in ciprofol exposures over the body weight range of 40–85 kg (corresponding BMI of 30 kg/m2) and the age range of 18–77 years are not expected to result in clinically meaningful change in efficacy or safety of ciprofol at the dose regimen used in the patients in the ICU undergoing mechanical ventilation. Therefore, no dose adjustment of ciprofol is needed based on weight and age. However, the conducted clinical studies for this PopPK analysis only included subjects with BMI less than or equal to 30. When it comes to obese subjects (BMI of 40 kg/m2), the simulated exposure levels for long‐term infusion increased significantly, suggesting a modified dosing strategy would be more reasonable for obese subjects receiving ciprofol. Indeed, for obese and morbidly obese subjects, dosing strategy based on lean body weight (LBW) instead of total body weight has been applied for propofol and various other commonly used anesthetic drugs. 45 In the two phase III studies performed in the United States (NCT04711837 and NCT05478174) which evaluate the efficacy and safety of ciprofol for induction of general anesthesia, LBW was also applied to determine the ciprofol dose for subjects with BMI greater than 40 kg/m2. Future data from these clinical studies may provide more recommendations on the optimized dosing of ciprofol for the obese population.
PopPK simulation based on the final model for the ICU patient population showed that the target concentration range (90% PI) corresponding to the desired sedation level (RASS score −2 to +1) was 77.0 to 215.6 ng/mL. To explore the appropriate ciprofol dosing regimen to achieve the target concentration range for mechanically ventilated patients in the ICU, a variety of dosing regimens was simulated. The results suggested that a loading dose of 0.1 mg/kg was more appropriate because a loading dose of 0.2 mg/kg could easily lead to concentrations higher than the target concentration range after a maintenance dose was given. In the case of the same loading dose, the shorter the infusion time, the higher the concentration after the maintenance dose. The infusion time of loading dose is preferably 3–5 minutes which is consistent with what was previously reported. 46 During the maintenance phase, when the maintenance dose was below or equal to 0.2 mg/kg/h, most simulated concentrations were below the target concentration range. For a maintenance dose of 0.3 mg/kg/h, the simulated concentrations were all within the target concentration range. However, as time goes by, some patients may have a higher concentration than the target range. To maintain a good sedative effect, the dose should be adjusted in line with the patient's specific condition.
The maintenance dose could be adjusted up to 0.8 mg/kg/h in mechanically ventilated patients in the ICU in studies HSK3486‐205 and HSK3486‐307. In a phase III study (HSK3486‐306) in patients undergoing elective surgery, the C max values during anesthesia were fairly high (median: 6291, 90% PI: 2449–18,167) ng/mL after a maintenance dose of 0.8 mg/kg/h. However, no apparent exposure–response relationship was observed for safety variables of hypotension, bradycardia, and injection site pain. For a maintenance dose of 0.8 mg/kg/h, the simulated median C max values were 464 ng/mL and 928 ng/mL for the loading dose of 0.1 mg/kg and 0.2 mg/kg, respectively, suggesting the selected dose regimen in the current ICU studies was safe.
Previous exposure–response analyses based on patients undergoing elective surgery showed no meaningful association between ciprofol exposure and efficacy and safety end points. The current exposure–safety analysis also indicated that no clinically meaningful exposure–response relationship was observed between the ciprofol exposure metrics (AMTindu and C max) and the probability of hypotension. Although an inverse correlation between exposure (C avg, and AUC0–10h) and hypotension was observed (p < 0.05), the exposure range overlapped between hypotension and non‐hypotension. In the current study, most subjects received an induction dose of 0.1 mg/kg. Although higher C max values were observed in some subjects receiving higher doses of 0.15–0.2 mg/kg, no hypotension occurred. This may be the main reason for the inverse relationship. Overall, the dose regimens used in studies HSK3486‐205 and HSK3486‐307 were highly effective and well‐tolerated for sedation in mechanically ventilated patients in the ICU. The lack of meaningful relationships between ciprofol plasma exposure and efficacy and safety outcomes demonstrated a favorable benefit–risk profile of the dose regimen currently used in mechanically ventilated patients in the ICU.
CONCLUSION
Ciprofol PKs was well‐characterized in elective surgical patients, mechanically ventilated patients in the ICU, and healthy subjects. Exposure–safety analysis indicated that ciprofol exposure was not associated with the risk of hypotension. In conclusion, this analysis supports the dosing regimen currently used in mechanically ventilated patients in the ICU.
AUTHOR CONTRIBUTIONS
L.L. and X.X. wrote the manuscript. P.Y. designed the research. N.W., M.H., X.L., and M.C. performed the research. L.L., Z.S., and K.W. analyzed the data.
FUNDING INFORMATION
No funding was received for this work.
CONFLICT OF INTEREST STATEMENT
As of the date of submission of this manuscript, L.L. and X.X. declare no potential conflicts of interest. K.W. and Z.S. are employees of Shanghai Qiangshi Information Technology Co., Ltd. and served as consultants for Haisco Pharmaceutical Group Co. Ltd. P.Y., N.W., M.H., X.L., and M.C. are employees of Haisco Pharmaceutical Group Co. Ltd.
Supporting information
Figure S1
Figure S2
Figure S3
Figure S4
Figure S5
Figure S6
Figure S7
Figure S8
Table S1
ACKNOWLEDGMENTS
This study was sponsored by Haisco Pharmaceutical Group Co. Ltd. The authors thank the patients who participated in the study, their supporters, and the investigators and clinical research staff from the study centers.
Liu L, Wang K, Sun Z, et al. Pharmacokinetics and exposure–safety relationship of ciprofol for sedation in mechanically ventilated patients in the intensive care unit. CPT Pharmacometrics Syst Pharmacol. 2024;13:823‐836. doi: 10.1002/psp4.13121
Contributor Information
Nan Wu, Email: wun@haisco.com.
Xiaoqiang Xiang, Email: xiangxq@fudan.edu.cn.
REFERENCES
- 1. Payen JF, Chanques G, Mantz J, et al. Current practices in sedation and analgesia for mechanically ventilated critically ill patients: a prospective multicenter patient‐based study. Anesthesiology. 2007;106(4):687‐695. doi: 10.1097/01.anes.0000264747.09017.da [DOI] [PubMed] [Google Scholar]
- 2. Sessler CN, Wilhelm W. Analgesia and sedation in the intensive care unit: an overview of the issues. Crit Care. 2008;12(Suppl 3):S1. doi: 10.1186/cc6147 [DOI] [PMC free article] [PubMed] [Google Scholar]
- 3. Temesgen N, Chekol B, Tamirie T, Eshetie D, Simeneh N, Feleke A. Adult sedation and analgesia in a resource limited intensive care unit – a systematic review and evidence based guideline. Ann Med Surg (Lond). 2021;66:102356. [DOI] [PMC free article] [PubMed] [Google Scholar]
- 4. Devlin JW, Roberts RJ. Pharmacology of commonly used analgesics and sedatives in the ICU: benzodiazepines, propofol, and opioids. Crit Care Clin. 2009;25(3):431‐449, vii. doi: 10.1016/j.ccc.2009.03.003 [DOI] [PubMed] [Google Scholar]
- 5. Urner M, Ferreyro BL, Douflé G, Mehta S. Supportive care of patients on mechanical ventilation. Respir Care. 2018;63(12):1567‐1574. doi: 10.4187/respcare.06651 [DOI] [PubMed] [Google Scholar]
- 6. Novak R. Ciprofol vs Propofol. December 30, 2022. Available at: https://theanesthesiaconsultant.com/2022/12/30/ciprofol‐vs‐propofol/
- 7. Pearson SD, Patel BK. Evolving targets for sedation during mechanical ventilation. Curr Opin Crit Care. 2020;26(1):47‐52. doi: 10.1097/MCC.0000000000000687 [DOI] [PMC free article] [PubMed] [Google Scholar]
- 8. Roberts RJ, Barletta JF, Fong JJ, et al. Incidence of propofol‐related infusion syndrome in critically ill adults: a prospective, multicenter study. Crit Care. 2009;13(5):R169. doi: 10.1186/cc8145 [DOI] [PMC free article] [PubMed] [Google Scholar]
- 9. Li X, Yang D, Li Q, et al. Safety, pharmacokinetics, and pharmacodynamics of a single bolus of the γ‐aminobutyric acid (GABA) receptor potentiator HSK3486 in healthy Chinese elderly and non‐elderly. Front Pharmacol. 2021;12:735700. doi: 10.3389/fphar.2021.735700 [DOI] [PMC free article] [PubMed] [Google Scholar]
- 10. Bian Y, Zhang H, Ma S, et al. Mass balance, pharmacokinetics and pharmacodynamics of intravenous HSK3486, a novel anaesthetic, administered to healthy subjects. Br J Clin Pharmacol. 2021;87(1):93‐105. doi: 10.1111/bcp.14363 [DOI] [PubMed] [Google Scholar]
- 11. Zhu Q, Luo Z, Wang X, et al. Efficacy and safety of ciprofol versus propofol for the induction of anesthesia in adult patients: a multicenter phase 2a clinical trial. Int J Clin Pharmacol. 2023;45:473‐482. doi: 10.1007/s11096-022-01529-x [DOI] [PMC free article] [PubMed] [Google Scholar]
- 12. Chen BZ, Yin XY, Jiang LH, Liu JH, Shi YY, Yuan BY. The efficacy and safety of ciprofol use for the induction of general anesthesia in patients undergoing gynecological surgery: a prospective randomized controlled study. BMC Anesthesiol. 2022;22(1):245. doi: 10.1186/s12871-022-01782-7 [DOI] [PMC free article] [PubMed] [Google Scholar]
- 13. Lu M, Liu J, Wu X, Zhang Z. Ciprofol: a novel alternative to propofol in clinical intravenous anesthesia? Biomed Res Int. 2023;2023:7443226. doi: 10.1155/2023/7443226 [DOI] [PMC free article] [PubMed] [Google Scholar]
- 14. Yu L, Bischof E, Lu HH. Anesthesia with ciprofol in cardiac surgery with cardiopulmonary bypass: a case report. World J Clin Cases. 2023;11(1):157‐163. doi: 10.12998/wjcc.v11.i1.157 [DOI] [PMC free article] [PubMed] [Google Scholar]
- 15. Liu Y, Chen C, Liu N, et al. Efficacy and safety of ciprofol sedation in ICU patients with mechanical ventilation: a clinical trial study protocol. Adv Ther. 2021;38(10):5412‐5423. doi: 10.1007/s12325-021-01877-6 [DOI] [PMC free article] [PubMed] [Google Scholar]
- 16. Liu Y, Yu X, Zhu D, et al. Safety and efficacy of ciprofol vs. propofol for sedation in intensive care unit patients with mechanical ventilation: a multi‐center, open label, randomized, phase 2 trial. Chin Med J. 2022;135(9):1043‐1051. doi: 10.1097/CM9.0000000000001912 [DOI] [PMC free article] [PubMed] [Google Scholar]
- 17. Liu L, Wang K, Yang Y, et al. Population pharmacokinetic/pharmacodynamic modeling and exposure–response analysis of ciprofol in the induction and maintenance of general anesthesia in patients undergoing elective surgery: a prospective dose optimization study. J Clin Anesth. 2024;92:111317. doi: 10.1016/j.jclinane.2023.111317 [DOI] [PubMed] [Google Scholar]
- 18. Hu C, Ou X, Teng Y, et al. Sedation effects produced by a ciprofol initial infusion or bolus dose followed by continuous maintenance infusion in healthy subjects: a phase 1 trial. Adv Ther. 2021;38(11):5484‐5500. doi: 10.1007/s12325-021-01914-4 [DOI] [PMC free article] [PubMed] [Google Scholar]
- 19. Teng Y, Ou MC, Wang X, et al. Pharmacokinetic and pharmacodynamic properties of ciprofol emulsion in Chinese subjects: a single center, open‐label, single‐arm dose‐escalation phase 1 study. Am J Transl Res. 2021;13(12):13791‐13802. [PMC free article] [PubMed] [Google Scholar]
- 20. Teng Y, Ou M, Wang X, et al. Efficacy and safety of ciprofol for the sedation/anesthesia in patients undergoing colonoscopy: phase IIa and IIb multi‐center clinical trials. Eur J Pharm Sci. 2021;164:105904. doi: 10.1016/j.ejps.2021.105904 [DOI] [PubMed] [Google Scholar]
- 21. Wang X, Wang X, Liu J, et al. Effects of ciprofol for the induction of general anesthesia in patients scheduled for elective surgery compared to propofol: a phase 3, multicenter, randomized, double‐blind, comparative study. Eur Rev Med Pharmacol Sci. 2022;26(5):1607‐1617. doi: 10.26355/eurrev_202203_28228 [DOI] [PubMed] [Google Scholar]
- 22. Liang P, Dai M, Wang X, et al. Efficacy and safety of HSK3486 vs. propofol for the induction and maintenance of general anaesthesia: a multicentre, single‐blind, randomised, parallel‐group, phase 3 clinical trial. Eur J Anaesthesiol. 2023. Jun 1;40(6):399‐406. doi: 10.1097/EJA.0000000000001799 [DOI] [PMC free article] [PubMed] [Google Scholar]
- 23. Lindstrom ML, Bates DM. Nonlinear mixed effects models for repeated measures data. Biometrics. 1990;46(3):673‐687. [PubMed] [Google Scholar]
- 24. Beal SL, Sheiner LB, Boeckmann AJ, Bauer RJ, eds. NONMEM user's guide part I–VII. University of California at San Francisco; 1988. –1992. [Google Scholar]
- 25. Lindbom L, Ribbing J, Jonsson EN. Perl‐speaks‐NONMEM (PsN)‐a Perl module for NONMEM related programming. Comput Methods Prog Biomed. 2004;75(2):85‐94. doi: 10.1016/j.cmpb.2003.11.003 [DOI] [PubMed] [Google Scholar]
- 26. Lindbom L, Pihlgren P, Jonsson EN. PsN‐toolkit‐a collection of computer intensive statistical methods for non‐linear mixed effect modeling using NONMEM. Comput Methods Prog Biomed. 2005;79(3):241‐257. doi: 10.1016/j.cmpb.2005.04.005 [DOI] [PubMed] [Google Scholar]
- 27. Liu SB, Yao X, Tao J, et al. Population total and unbound pharmacokinetics and pharmacodynamics of ciprofol and M4 in subjects with various renal functions. Br J Clin Pharmacol. 2023;89(3):1139‐1151. doi: 10.1111/bcp.15561 [DOI] [PubMed] [Google Scholar]
- 28. Eleveld DJ, Koomen JV, Absalom AR, et al. Allometric scaling in pharmacokinetic studies in anesthesiology. Anesthesiology. 2022;136:609‐617. doi: 10.1097/ALN.0000000000004115 [DOI] [PubMed] [Google Scholar]
- 29. Germovsek E, Cheng M, Giragossian C. Allometric scaling of therapeutic monoclonal antibodies in preclinical and clinical settings. MAbs. 2021;13:1. doi: 10.1080/19420862.2021.1964935 [DOI] [PMC free article] [PubMed] [Google Scholar]
- 30. Bergstrand M, Hooker AC, Wallin JE, Karlsson MO. Prediction‐corrected visual predictive checks for diagnosing nonlinear mixed‐effects models. AAPS J. 2011;13(2):143‐151. doi: 10.1208/s12248-011-9255-z [DOI] [PMC free article] [PubMed] [Google Scholar]
- 31. Harling K, Uekcert S, Hooker A. NPC/VPC userguide and technical description. 2011‐05‐26 PsN 3.4.2. Available from: https://manualzz.com/doc/36458926/npc‐vpc‐userguide‐and‐technical‐description
- 32. Ette EI. Stability and performance of a population pharmacokinetic model. J Clin Pharmacol. 1997;37(6):486‐495. doi: 10.1002/j.1552-4604.1997.tb04326.x [DOI] [PubMed] [Google Scholar]
- 33. Bootstrap user guide . PsN 5.0.0, revised. 2018. Available from: https://github.com/UUPharmacometrics/PsN/releases/download/5.0.0/bootstrap_userguide.pdf [cited 2 February 2023]
- 34. Savic RM, Karlsson MO. Importance of shrinkage in empirical bayes estimates for diagnostics: problems and solutions. AAPS J. 2009;11(3):558‐569. doi: 10.1208/s12248-009-9133-0 [DOI] [PMC free article] [PubMed] [Google Scholar]
- 35. Medlej K. Calculated decisions: Richmond agitation‐sedation scale (RASS). Emerg Med Pract. 2021;23(Suppl 3):CD3‐CD4. [PubMed] [Google Scholar]
- 36. Geng Y, Jiang X. A clinical study on the effects of dexmedetomidine on off‐line extubation of invasive mechanical ventilation. Int J Clin Exp Med. 2018;11(4):4094‐4100. [Google Scholar]
- 37. Eleveld DJ, Colin P, Absalom AR, Struys MMRF. Pharmacokinetic‐pharmacodynamic model for propofol for broad application in anaesthesia and sedation. Br J Anaesth. 2018;120(5):942‐959. doi: 10.1016/j.bja.2018.01.018 [DOI] [PubMed] [Google Scholar]
- 38. Sahinovic MM, Struys MMRF, Absalom AR. Clinical pharmacokinetics and pharmacodynamics of propofol. Clin Pharmacokinet. 2018;57(12):1539‐1558. doi: 10.1007/s40262-018-0672-3 [DOI] [PMC free article] [PubMed] [Google Scholar]
- 39. Brush DR, Kress JP. Sedation and analgesia for the mechanically ventilated patient. Clin Chest Med. 2009;30(1):131‐141, ix. doi: 10.1016/j.ccm.2008.09.001 [DOI] [PubMed] [Google Scholar]
- 40. Albanese J, Martin C, Lacarelle B, Saux P, Durand A, Gouin F. Pharmacokinetics of long‐term propofol infusion used for sedation in ICU patients. Anesthesiology. 1990;73(2):214‐217. doi: 10.1097/00000542-199008000-00004 [DOI] [PubMed] [Google Scholar]
- 41. Bilbao‐Meseguer I, Rodríguez‐Gascón A, Barrasa H, Isla A, Solinís MÁ. Augmented renal clearance in critically ill patients: a systematic review. Clin Pharmacokinet. 2018;57(9):1107‐1121. [DOI] [PubMed] [Google Scholar]
- 42. Knights KM, Rowland A, Miners JO. Renal drug metabolism in humans: the potential for drug‐endobiotic interactions involving cytochrome P450 (CYP) and UDP‐glucuronosyltransferase (UGT). Br J Clin Pharmacol. 2013;76(4):587‐602. [DOI] [PMC free article] [PubMed] [Google Scholar]
- 43. Morales Castro D, Dresser L, Granton J, Fan E. Pharmacokinetic alterations associated with critical illness. Clin Pharmacokinet. 2023;62(2):209‐220. [DOI] [PMC free article] [PubMed] [Google Scholar]
- 44. Li C, Zhu X, Lou J, et al. Safety, pharmacokinetics and pharmacodynamics of a novel γ‐aminobutyric acid (GABA) receptor potentiator, HSK3486, in Chinese patients with hepatic impairment. Ann Med. 2022;54(1):2769‐2780. doi: 10.1080/07853890.2022.2129433 [DOI] [PMC free article] [PubMed] [Google Scholar]
- 45. Nightingale CE, Margarson MP, Shearer E, et al. Members of the working party. Peri‐operative management of the obese surgical patient 2015: Association of Anaesthetists of Great Britain and Ireland Society for Obesity and Bariatric Anaesthesia. Anaesthesia. 2015;70:859‐876. doi: 10.1111/anae.13101 [DOI] [PMC free article] [PubMed] [Google Scholar]
- 46. Barr J, Egan TD, Sandoval NF, et al. Propofol dosing regimens for ICU sedation based upon an integrated pharmacokinetic‐pharmacodynamic model. Anesthesiology. 2001;95(2):324‐333. doi: 10.1097/00000542-200108000-00011 [DOI] [PubMed] [Google Scholar]
Associated Data
This section collects any data citations, data availability statements, or supplementary materials included in this article.
Supplementary Materials
Figure S1
Figure S2
Figure S3
Figure S4
Figure S5
Figure S6
Figure S7
Figure S8
Table S1