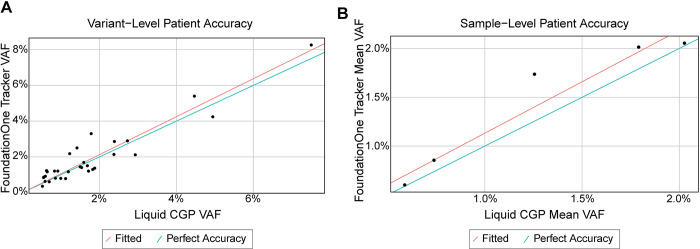
Fig 5. Accuracy using orthogonal method.
A) Scatter plots of variant-level FoundationOne®Tracker (Y axis) vs liquid CGP (X axis) measured plasma VAF values for patient samples along with the fitted Passing-Bablok regression line (red) and a line indicating perfect fit (x = y, blue). B) Scatter plots of sample-level FoundationOne Tracker (Y axis) vs Liquid CGP (X axis) measured mean plasma VAF values for patient samples along with the fitted Passing-Bablok regression line (red) and a line indicating perfect fit (x = y, blue).

