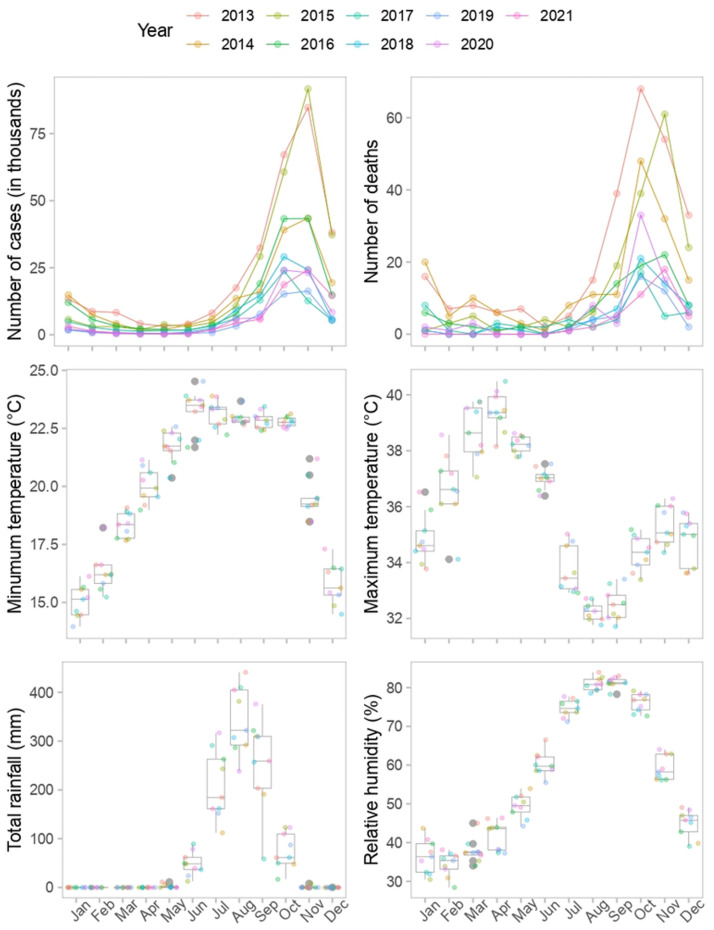
Fig 5. Variation of the climatic variables, total malaria cases and deaths in each month over the years.
In the upper panels of the first row, we can observe the number of malaria cases and deaths in thousands, although not used as predictors. Each line represents a different year, indicated by the various colors. The bottom four panels show the climate variables and their variability. The boxplots depict each month of the year, while the colored dots represent the data points in the corresponding years. The minimum and maximum temperatures were measured in degrees Celsius (°C), the rainfall was measured in millimeters (mm), and the relative humidity was measured in percentages (%).

