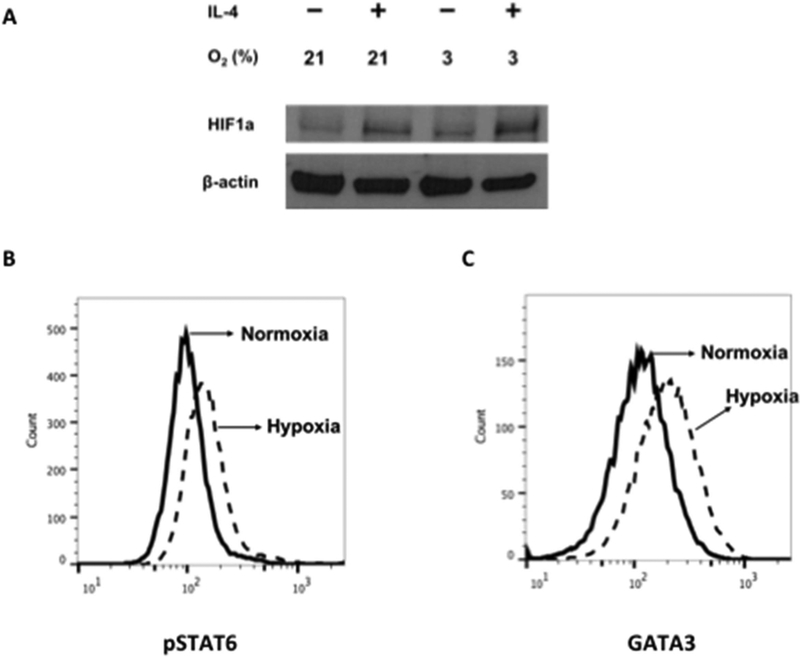
Figure 3: Lineage-specific transcription factor protein expression in CD8+ T cells.
CD8+ T cells were differentiated in IL-2 or IL-2 plus IL-4 under normoxic or hypoxic conditioning. A, HIF-1α protein levels detected by using immunoblot analysis in differentiated CD8+ T cells. B and C, Representative flow cytometric analyses of pSTAT6 (Fig 3, B) and GATA-3 (Fig 3, C) protein expression in TC2 cells differentiated in IL-2 plus IL-4 for 24 hours. Cells were gated on the CD8+ population. Solid line, Differentiation under normoxic conditioning; dashed line, differentiation under hypoxic conditioning. Experiments were repeated 3 times with similar results.

