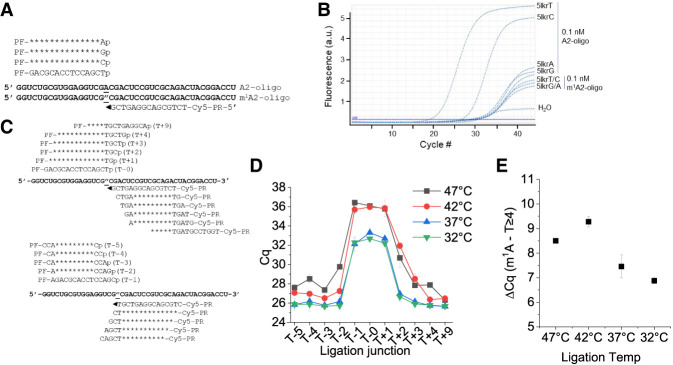
FIGURE 3.
Optimization of TL-qPCR efficiency regarding m1A proximity and ligation temperature. (A) Oligonucleotides used and ligation oligo design. (B) Amplification curves of linker 5lkrT/C/G/A in A and m1A oligo in ligation. (C) Ligation oligo design at varying ligation sites away from the m1A site. (D) Cq plots as a function of ligation oligos with ligation sites at m1A (T + 0) or progressively away from the m1A site. (E) ΔCq values between the m1A site and control site (using average Cq values of sites ≥4 nt away from the m1A site) under different template splint ligation temperatures.

