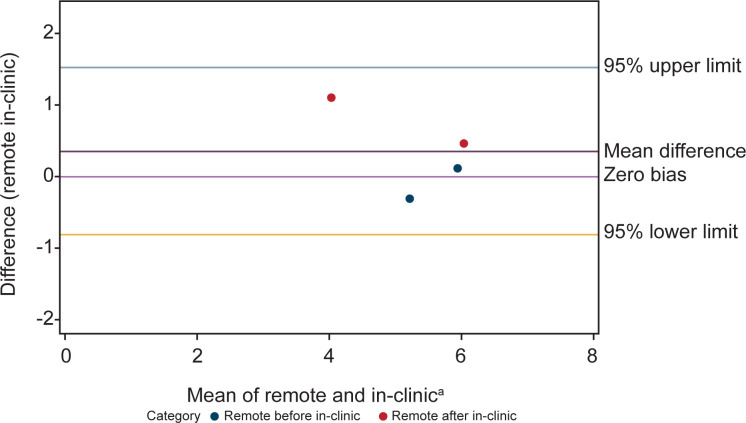
Fig 3. Bland-Altman analysis plot of remote and in-clinic assessments shows relative agreement between the two modalities for the 10MWR assessment.
Measurements closer to the center line of zero bias mean difference indicate higher levels of agreement. aX-axis is time in seconds. 10MWR, 10-meter Walk/Run.

