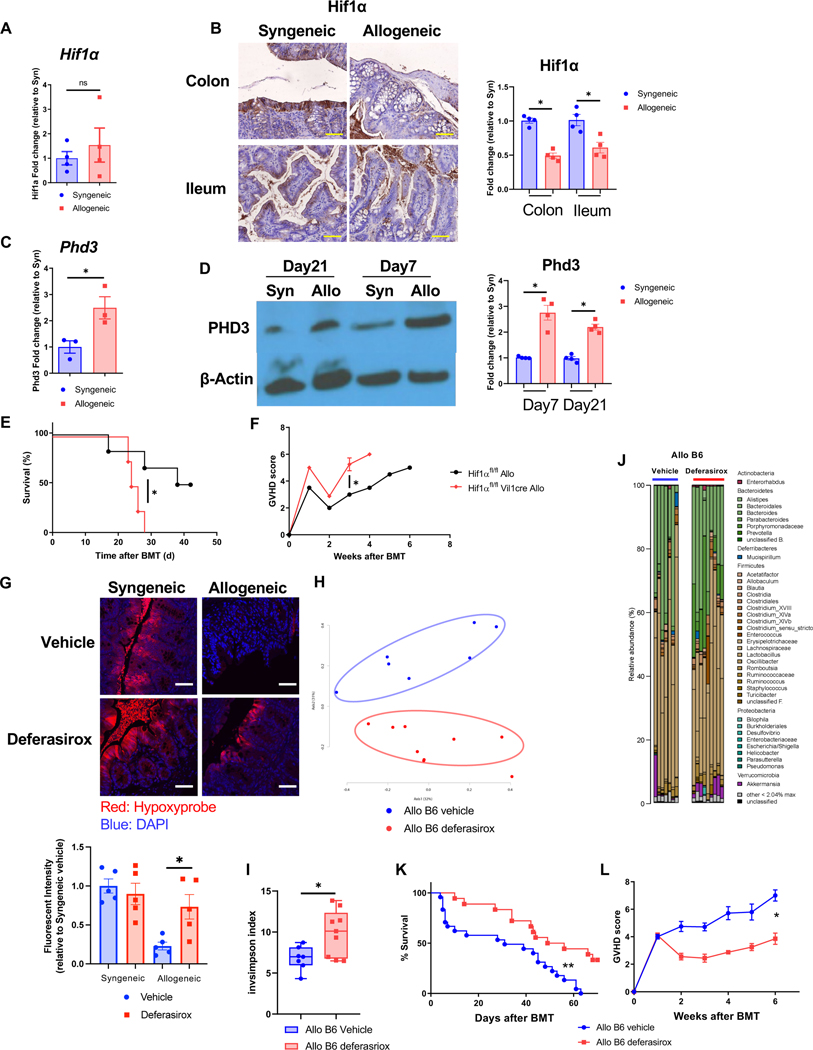
Figure 7. O2 modulation after allo-HSCT improves intestinal physiologic hypoxia and GVHD.
(A to D) B6 received BMT from syngeneic B6 or allogeneic BALB/c donor. (A) Hif1α mRNA expression of isolated colonic IECs from BMT recipients 21days after BMT (N=4). (B) Representative image and the relative intensity of HIF1α immunohistochemical staining with intestinal tissue from BMT recipients 21days after BMT are shown (Scale bar=50μm, N=4). (C) Egln3 (Phd3) mRNA expression of isolated colonic IECs from BMT recipients on day21 after BMT (N=3). (D) Representative image of immunoblot and the relative protein density for PHD3 and β-Actin with colonic IECs from BMT recipients 21days after BMT are shown (N=4). (E and F) Hif1αfl/fl mice and Hif1αfl/fl Vil1cre mice received BMT from BALB/c donor. Survival rate (E) and clinical GVHD (F) score are shown (Hif1αfl/fl allogeneic: N=6, Hif1αfl/fl Vil1cre: N=4). (G to L) B6 received BMT from BALB/c donor mice. BMT recipients were orally treated with deferasirox (20mg/kg) and vehicle every day. (G) Hypoxyprobe staining and relative fluorescent intensity in colon from recipients 21days after BMT (scale bar= 50μm). Four independent experiments were performed. Stool from BMT recipients were analyzed by 16S rRNA gene sequencing. PCoA (H), inverse Simpson alpha diversity index of microbiome (I), and microbiome composition (J) in stool from recipients 21days after BMT were shown (Allo B6 vehicle: N=7, Allo B6 deferasirox: N=9). Survival rate (K) and clinical GVHD score (L) of BMT recipients (Allo B6 vehicle: N=24, Allo B6 deferasirox: N=10). Representative plots and a graph summarizing the results of at least two independent experiments are shown. Two-tailed unpaired t-test (A, C, G, I), two-tailed Mann-Whitney test (B, D, F, L), or log-rank test (E, K) (mean ± s.e.m.) were used to determine significance. *P < 0.05, **P<0.01. See also Figure S6.

