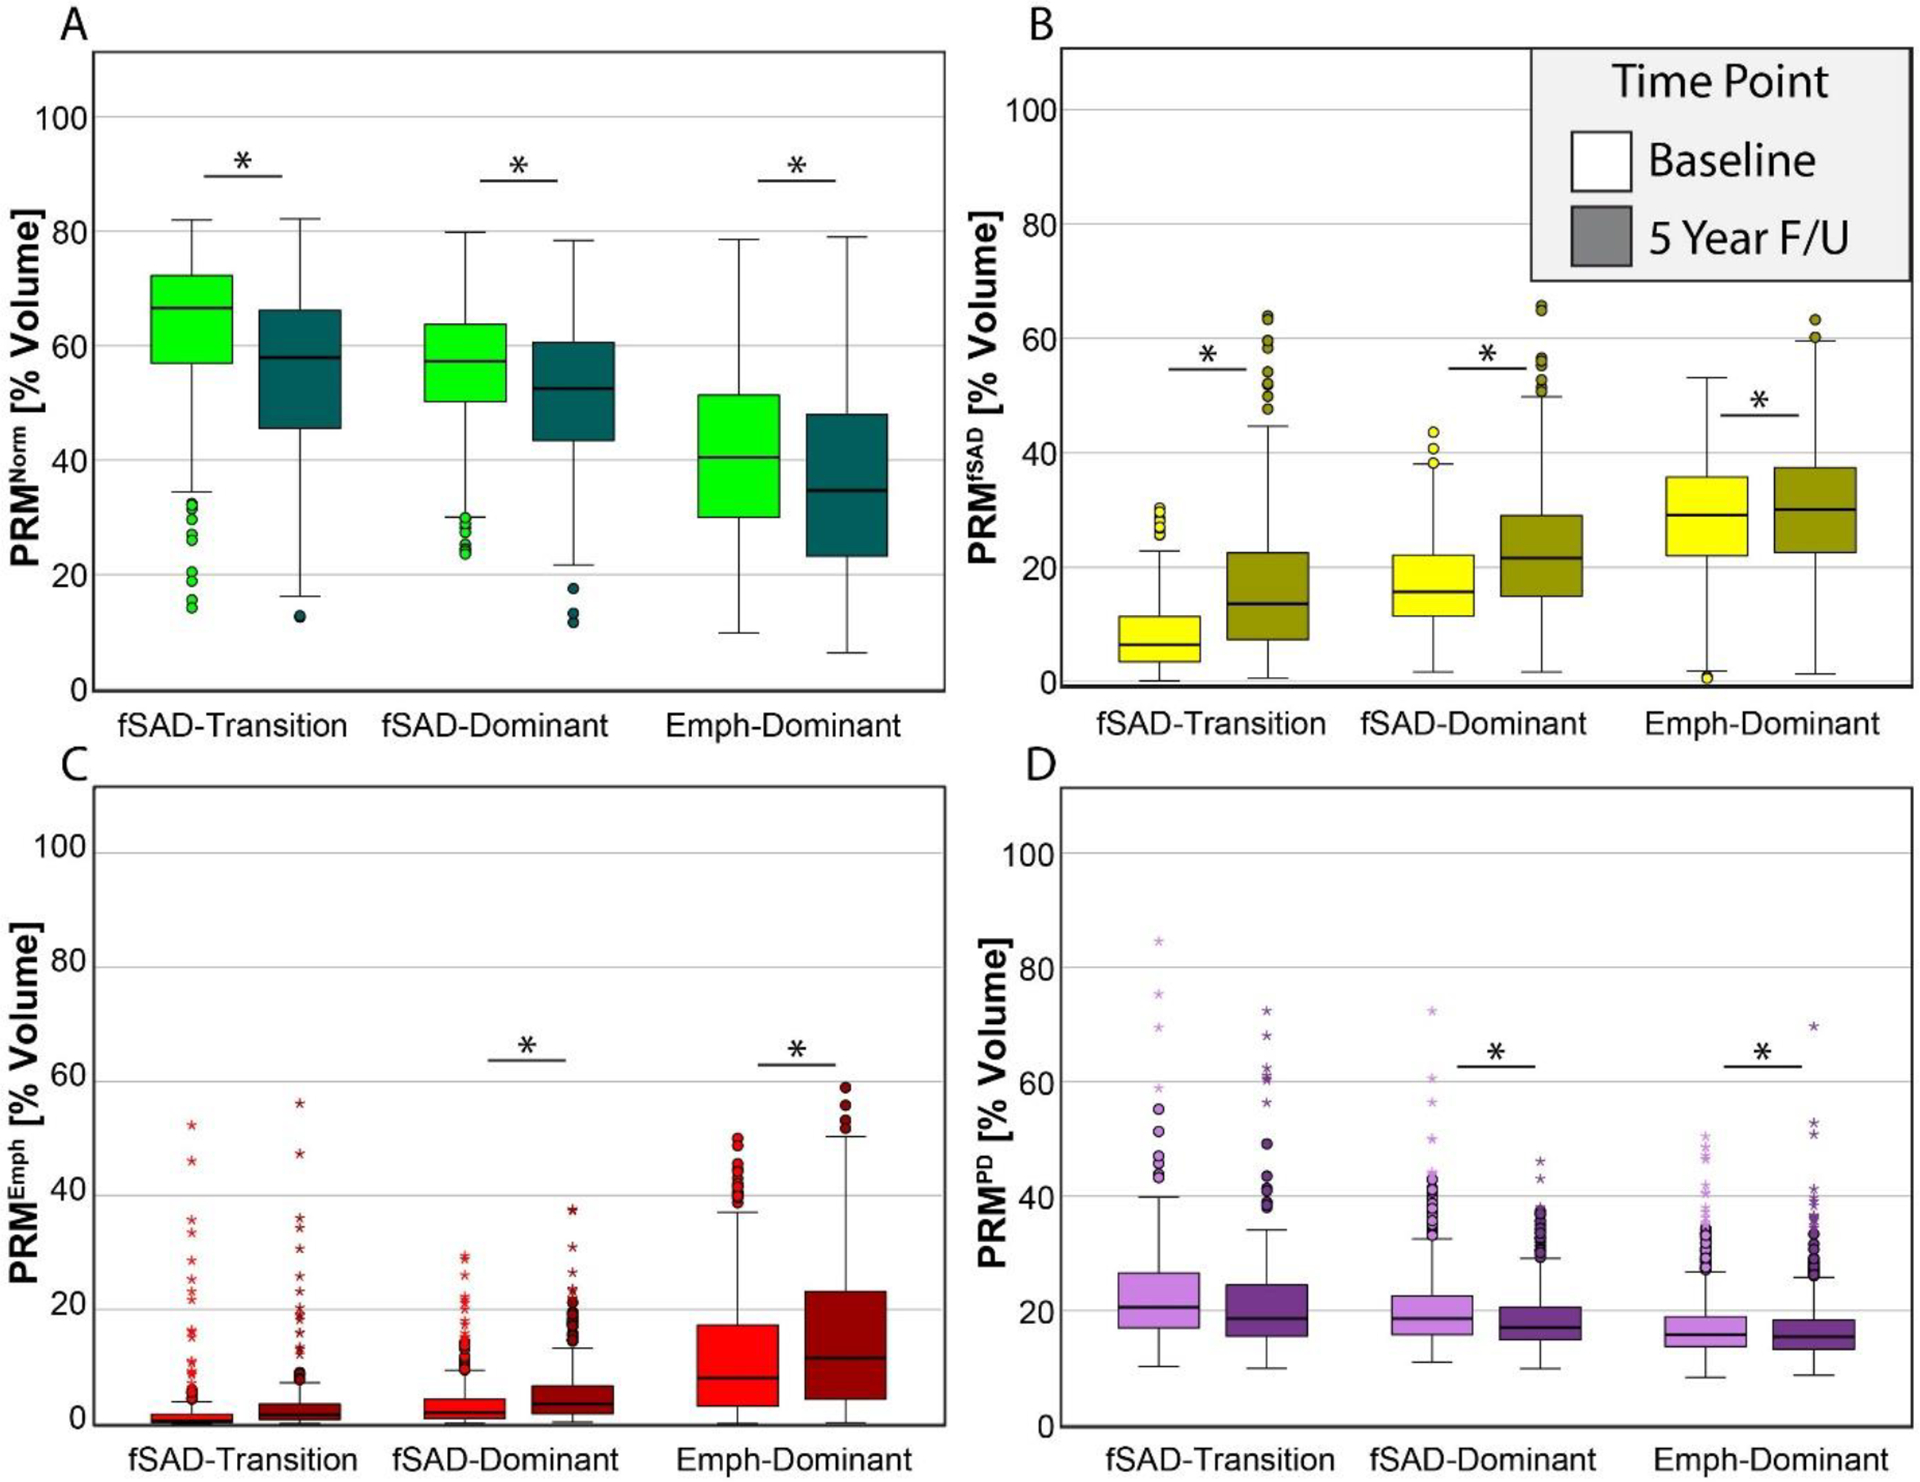
Figure 3:

Box and whisker plots for Phase 1 and 2 measurements of the percent volume of PRM classifications (A) Norm (normal parenchyma; color coded green), (B) fSAD (functional small airways disease, color coded yellow), (C) emphysema (color coded red) and (D) PD (parenchymal disease; color coded magenta). Box represents the 25th and 75th percentiles, line represents median, and whiskers represent minimum and maximum values. Circles and stars represent outliers and extreme values. * indicates significant difference between time intervals at p<0.05.
