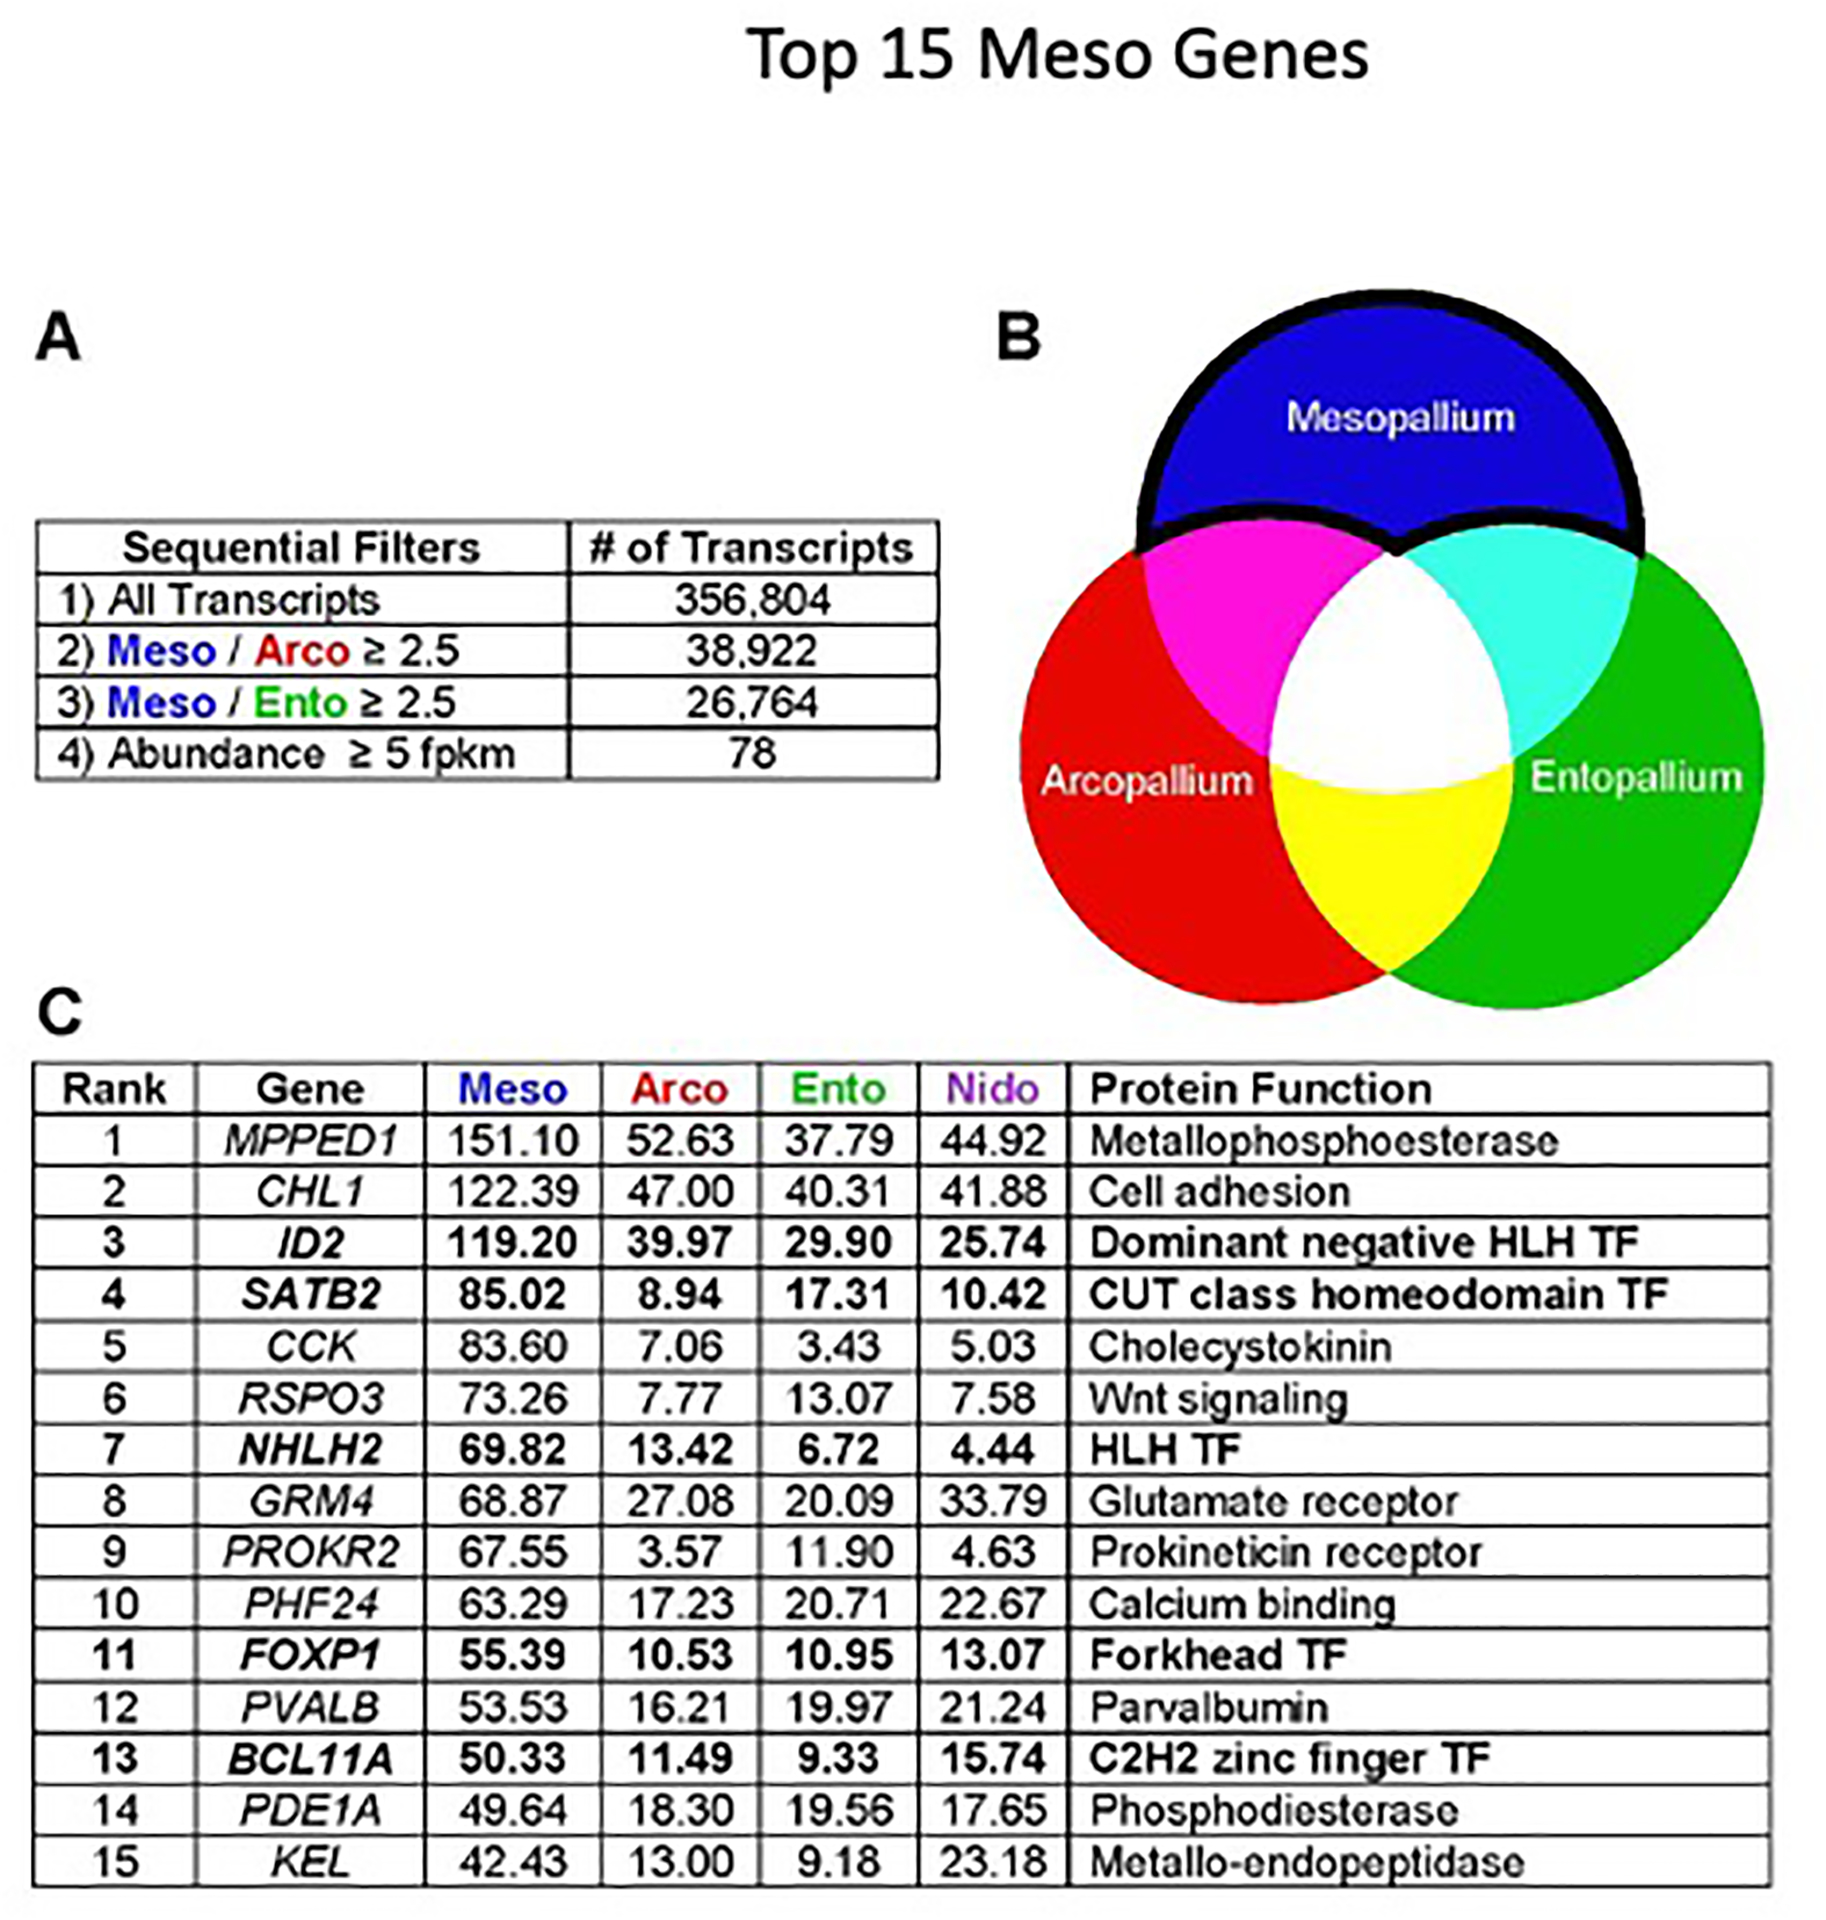
Figure 2. HOLT analysis of the mesopallium transcriptome.

(A) The HOLT pipeline is based on serial pairwise comparisons of transcript abundance. We first selected transcripts enriched in mesopallium compared with arcopallium, and from these, selected transcripts enriched in mesopallium compared with entopallium. We then ordered the mesopallium-selective transcripts by FPKM value.
(B) Visual representation of target transcripts: our HOLT approach is designed to detect transcripts enriched in mesopallium association neurons, but not in output or input neurons.
(C) The 15 most highly expressed mesopallium-enriched genes. Transcription factors are highlighted in bold type. Values indicate expression levels in FPKM. TF, Transcription Factor.
