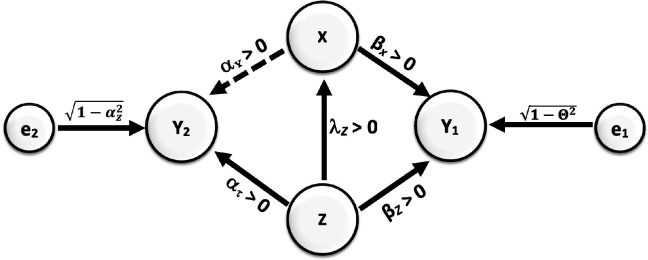
Figure 4. Causal relationships of outcome, covariate, and potentially biasing covariate (PBC).
Direction of arrows represents causal directions and λz, αz, αx, βz, and βx are structural coefficients. The error terms e1 and e2 have variances chosen so Y1 and Y2 have variances 1 (see the Appendices for more details).

