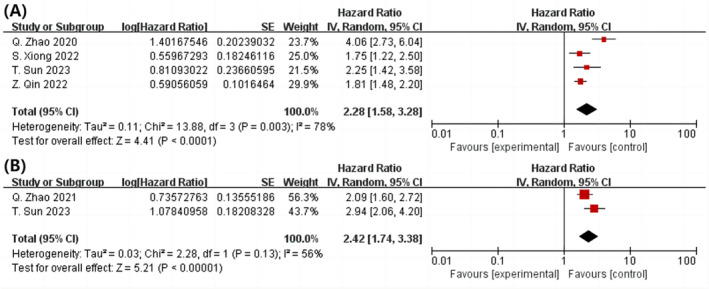
Figure 3.

In the post‐PCI population with diabetes, a forest plot illustrating the connection between the TyG index and MACE is shown. With (A) or without diabetes (B) (highest vs. lowest) were examined as category variables. MACE, major adverse cardiovascular events; PCI, percutaneous coronary intervention; TyG, triglyceride‐glucose.
