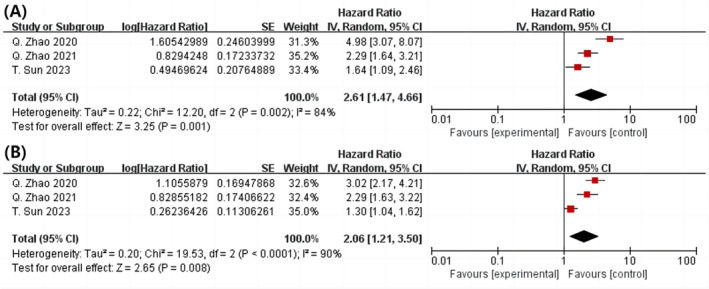
Figure 6.

Analysed as category variables greatest and lowest, a forest plot showing the connection among the TyG index and revascularization in the population following PCI (A) and per 1 standard unit (B). PCI, percutaneous coronary intervention; TyG, triglyceride‐glucose.
