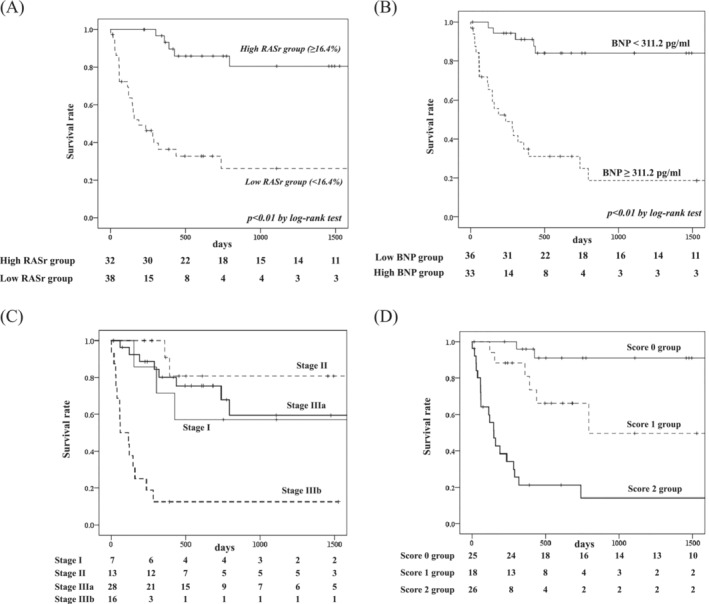
Figure 4.

Kaplan–Meier curves for all‐cause death in patients with AL cardiac amyloidosis with high or low RASr (A) and low or high BNP (B) based on a previously reported staging system: stage I, II, IIIa and IIIb (C), and the new staging system: score 0, 1, and 2 (D). AL cardiac amyloidosis, immunoglobulin light‐chain cardiac amyloidosis; RASr, right atrial strain during the reservoir phase.
