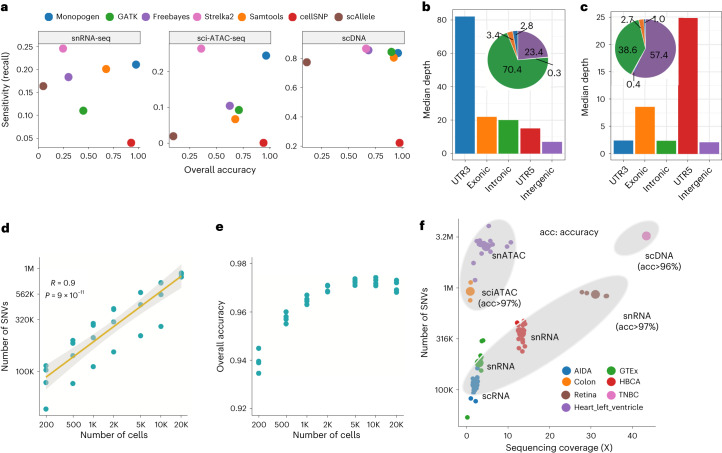
Fig. 2. Benchmarking of Monopogen performance in various single-cell sequencing platforms.
a, Overall accuracy and SNV detection sensitivity (recall) in representative snRNA-seq (n = 4), sci-ATAC-seq data (n = 2) and scDNA-seq data (n = 1) using matched WGS data as the gold standard, comparing Monopogen against Samtools, GATK, FreeBayes, Strelka2, cellSNP and scAllele. The x axis denotes the overall accuracy and y axis denotes the detection sensitivity (recall). The closer a dot is to the top-right corner, the better the corresponding method has performed. Note, in a for Monopogen evaluation, only the SNVs present in the 1KG3 were considered. b,c, Median sequencing depth of SNVs found from snRNA-seq data (b) and sci-ATAC-seq data (c) over gene annotations. The pie charts show the percentage of SNVs in each category. d, Number of SNVs versus the number of cells in the retina data via downsampling. The x and y axes are on logarithmic scale. Pearson’s correlations were applied to calculate the R and the P values. e, Overall accuracy versus cell number. f. Number of SNVs detected from seven single-cell sequencing datasets. The sequencing coverage was calculated as the , where L is the read length and n is the total number of reads in one sample. Each small dot corresponds to a sample, while each big dot is the mean value of a dataset. All the dots are colored by dataset. The top ellipse covers samples from scATAC-seq data and the bottom ellipse samples from scRNA-seq data.

