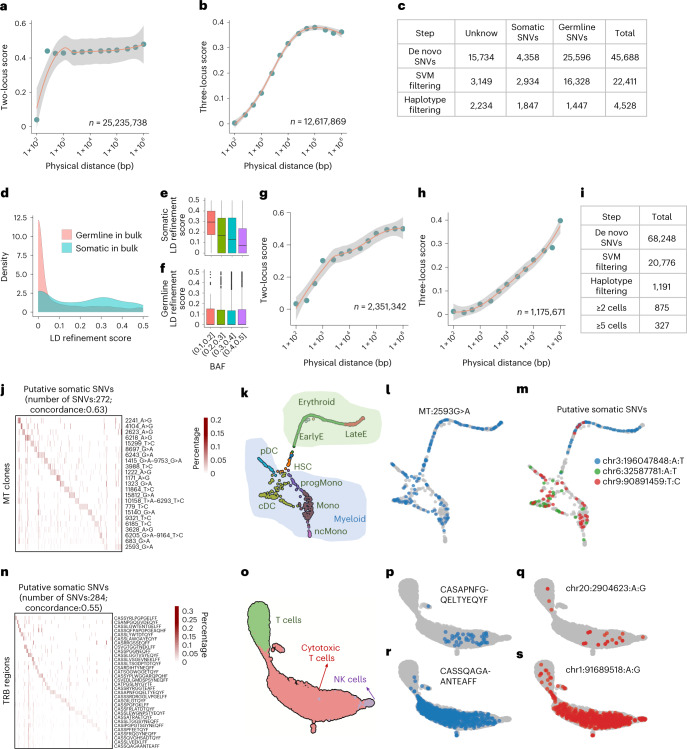
Fig. 5. Somatic SNV detection in single-cell sequencing.
a,b, LD refinement scores on germline SNVs from the TNBC single-cell DNA data. It is shown with two-locus model in a and three-locus model in b. c, Evaluation of de novo SNVs from Monopogen by comparison with categories defined in matched bulk DNA sample (Methods). d, Distribution of LD refinement scores for de novo SNVs that are classified as germline and somatic SNVs from the bulk sample. e,f, Boxplot displaying the relationship between LD refinement score and BAF, with SNVs classified as somatic (e, n = 339) and germline SNVs (f, n = 2,425). The centerline defines the median, the height of the box is given by the interquartile range (IQR), the whiskers are given by 1.5× IQR and outliers are given as points beyond the minimum or maximum whisker. g,h, LD refinement scores on germline SNVs from the bone-marrow sample measured in single-cell RNA data. It is shown with two-locus model in g and three-locus model in h. In a, b, g and h, the length of haplotypes is grouped into 13 bins (Methods). The x axis is in logarithmic scale. The y axis shows the mean value of LD refinement score within each bin together with the 95% confidence interval. The total number of haplotypes used for evaluation is labeled at the right-bottom of each panel. i, Number of SNVs detected in each step from Monopogen. j, Heatmap displaying the detected percentage of putative somatic SNVs in each mtDNA clone (the sum of each row is 1). k, UMAPs displaying the cell types annotated in myeloid and erythroid lineages. l,m. UMAPs displaying the mutated cell distribution for mtDNA variant 2593G:A (l) and three selected putative somatic SNVs from scRNA-seq (m). n, Heatmap displaying the detected percentage of putative somatic SNVs in each TRB clone. o–s. UMAPs displaying the cell types annotated in T/NK cell lineages (o), the mutated cell distribution for TRB region CASAPNFGQELTYEQYF (p) and the putative somatic SNV chr20:2904623A:G (q), the mutated cell distribution for TRB region CASSQAGAANTEAFF (r) and the somatic SNV chr1:91689518A:G (s).

