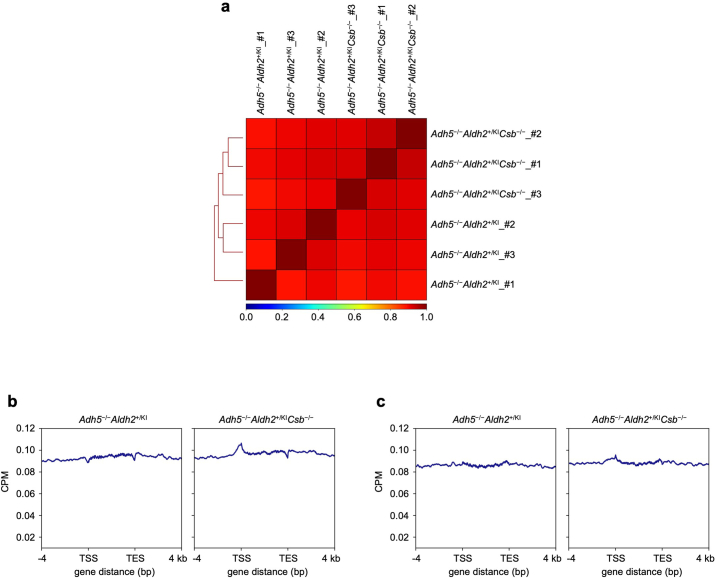
Extended Data Fig. 9. DPC-seq in mice.
(a) A hierarchically clustered heatmap showing Spearman’s rank-correlation coefficients of DPC-seq signal intensities (CPM) between Adh5–/–Aldh2+/KI and Adh5–/–Aldh2+/KICsb–/– mice. (b and c) Metagene profile from input samples around the transcribed regions of genes with TPM ≥ 30 (b) and 0.01 ≤ TPM < 0.1 (c). TSS: transcription start site; TES: transcription end site. Data represent the average of two mice.

