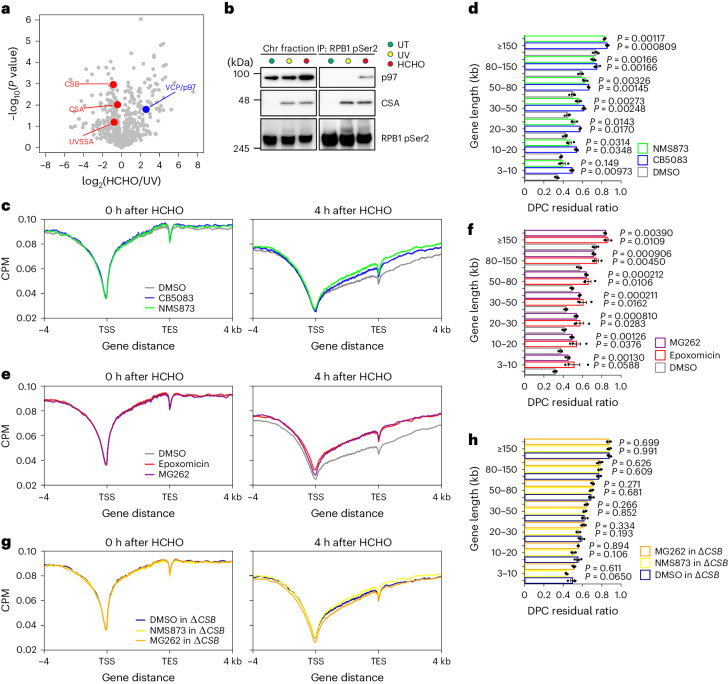
Fig. 3. DPC removal by VCP/p97 and the proteasome in active genes.
a, Volcano plot of MS analyses illustrating the interacting proteins with elongating RNAPII following formaldehyde treatment compared to UV irradiation. The plot displays the log2(fold change) and significance (−log10(P value)). Unpaired two-sided t-test. Permutation-based FDR < 0.05 (n = 3). Supplementary Table 2 provides the full results. b, Chromatin fractions of HeLa cells after formaldehyde treatment or UV irradiation were subjected to immunoprecipitation with anti-RPB1 CTD phospho-Ser2 antibodies, followed by immunoblotting with the indicated antibodies. Experiments were independently replicated twice with consistent results. c, Metagene profile from DPC-seq within or near transcribed regions of genes with TPM ≥ 30 at 0 and 4 h after formaldehyde washout in cells treated with VCP/p97 inhibitors. Data represent the average of two replicates. d, DPC residual ratios in cells treated with VCP/p97 inhibitors, shown in seven gene-length bins with TPM ≥ 100. Means (±s.e.m.) from three independent experiments are shown. Two-sided unpaired t-test. e, Metagene profile from DPC-seq within or near transcribed regions of genes with TPM ≥ 30 at 0 and 4 h after formaldehyde washout in HeLa cells treated with proteasome inhibitors. Data represent the average of three replicates. f, DPC residual ratios in cells treated with proteasome inhibitors are shown in seven gene-length bins with TPM ≥ 100. Means (±s.e.m.) from three independent experiments are shown. Two-sided unpaired t-test. g, Metagene profile from DPC-seq within or near transcribed regions of genes with TPM ≥ 30 at 0 and 4 h after formaldehyde washout in ΔCSB HeLa cells treated with the indicated inhibitors. Data represent the average of three replicates. h, DPC residual ratios in ΔCSB HeLa cells treated with the indicated inhibitors, shown in seven gene-length bins with TPM ≥ 100. Means (±s.e.m.) from three independent experiments are shown. Two-sided unpaired t-test. Source numerical data and unprocessed blots are available in the source data.

