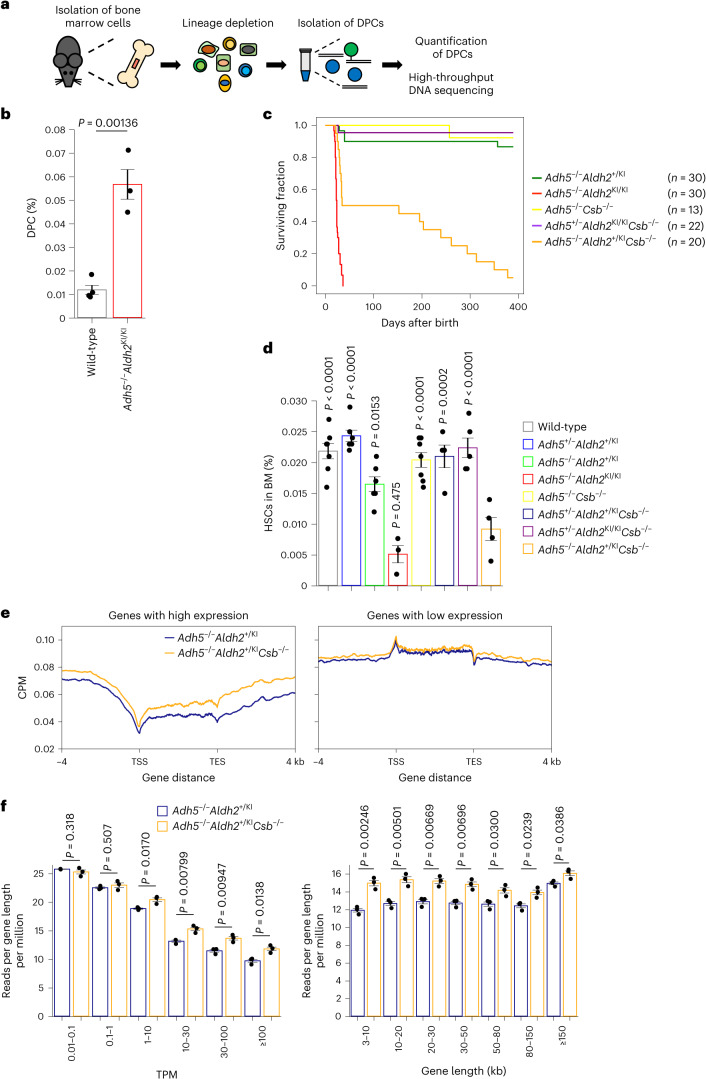
Fig. 6. TCR is required for the removal of DPCs in mice.
a, In vivo DPC-seq: schematic representation of the experimental procedure for the measurement of endogenous aldehyde-induced DPCs in mice. b, Quantification of DPCs in lineage-depleted bone marrow cells from WT and AMeDS model mice (means ± s.e.m.; n = 4 for wild-type, n = 3 for Adh5−/−Aldh2KI/KI). Two-sided unpaired t-test. c, Kaplan–Meier curves with log-rank test show a significant decrease in the survival of Adh5−/−Aldh2+/KICsb−/− animals compared to Adh5−/−Aldh2+/KI or Adh5−/−Csb−/− animals (P < 0.0001). d, Quantification of HSCs (Lin−c-Kit+Sca-1+CD150+CD48−) in the indicated genotype animals (means ± s.e.m.; n = 7 for wild-type, n = 6 for Adh5+/−Aldh2+/KI, n = 6 for Adh5−/−Aldh2+/KI, n = 3 for Adh5−/−Aldh2KI/KI, n = 7 for Adh5−/−Csb−/−, n = 4 for Adh5+/−Aldh2+/KICsb−/−, n = 5 for Adh5+/−Aldh2KI/KICsb−/−, n = 4 for Adh5−/−Aldh2+/KICsb−/−). Statistical significance was evaluated with Dunnett’s multiple comparison test. P compared to Adh5−/−Aldh2+/KICsb−/− mice. BM, bone marrow. e, Metagene profile from DPC-seq within or near transcribed regions of genes with TPM ≥ 30 (left) and 0.01 ≤ TPM < 0.1 (right). Data represent the average of three mice. f, DPC-seq read counts (reads per gene length per million) are shown in six TPM bins (left) and in seven gene-length bins (right). Means (±s.e.m.) from three mice are shown. Two-sided unpaired t-test. Source numerical data are available in the source data.

