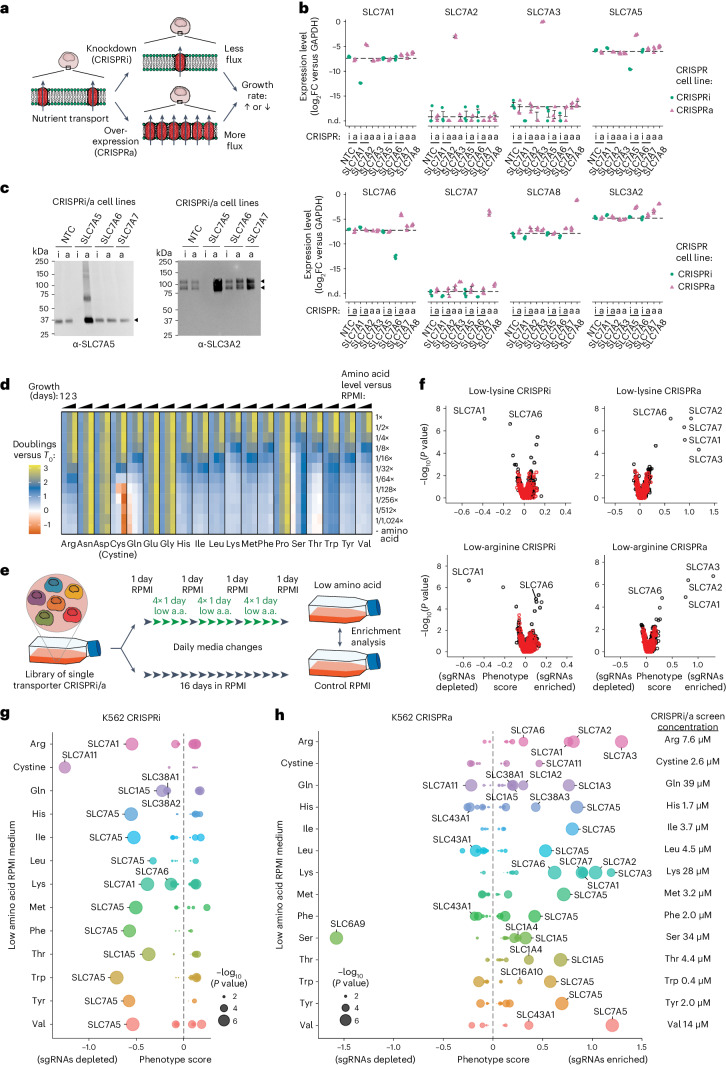
Fig. 1. CRISPRi/a screens identify the transporters of amino acids in K562 cells.
a, A cartoon of the general approach used to identify transporters in cells. Individual transporter genes are knocked down via CRISPRi or overexpressed via CRISPRa, and modified transport activity is detected by changes in proliferation. b, CRISPRi/a of transporters leads to specific changes in gene expression. Expression levels in K562 CRISPRi/a cells with specific or non-targeting control (NTC) sgRNAs were quantified by RT–qPCR relative to the housekeeping gene GAPDH. Data are mean ± s.e.m of n = 3 technical replicates. The horizontal dashed lines represent the average of both NTCs. n.d., not detected. c, CRISPRi/a of transporters leads to changes in protein level at the plasma membrane. K562 CRISPRi/a cells were incubated with a cell-impermeable biotinylation reagent, and plasma membrane proteins were isolated by streptavidin affinity purification and analysed by western blotting. d, The identification of amino acids that limit proliferation of K562 cells when their level in growth medium is reduced. Data were determined using a luminescent cell viability assay and represent the average log2FC relative to time of 0 days (T0) of n = 4 biologically independent samples. e, A cartoon of the pooled screening strategy used to identify amino acid transporters. Library pools were grown in RPMI media where specific amino acids were present at a level that reduced proliferation by 50% relative to complete RPMI (low amino acid). a.a., amino acid. f, Volcano plots of transporter CRISPRi/a screens in K562 cells in low lysine and low arginine. Black circles represent transporter genes, and red circles represent negative control genes. n = 2 screen replicates. g, Bubble plots displaying CRISPRi screen scores determined for all 64 transporters annotated as capable of amino acid transport12. h, Same as g for CRISPRa screens. In f–h, the phenotype scores represent averaged and normalized sgRNA enrichments in low amino acid versus RPMI, and −log10(P value) was determined using a Mann–Whitney test of sgRNA enrichments compared with all NTC sgRNAs. Source numerical data and unprocessed blots are available in Source data.

