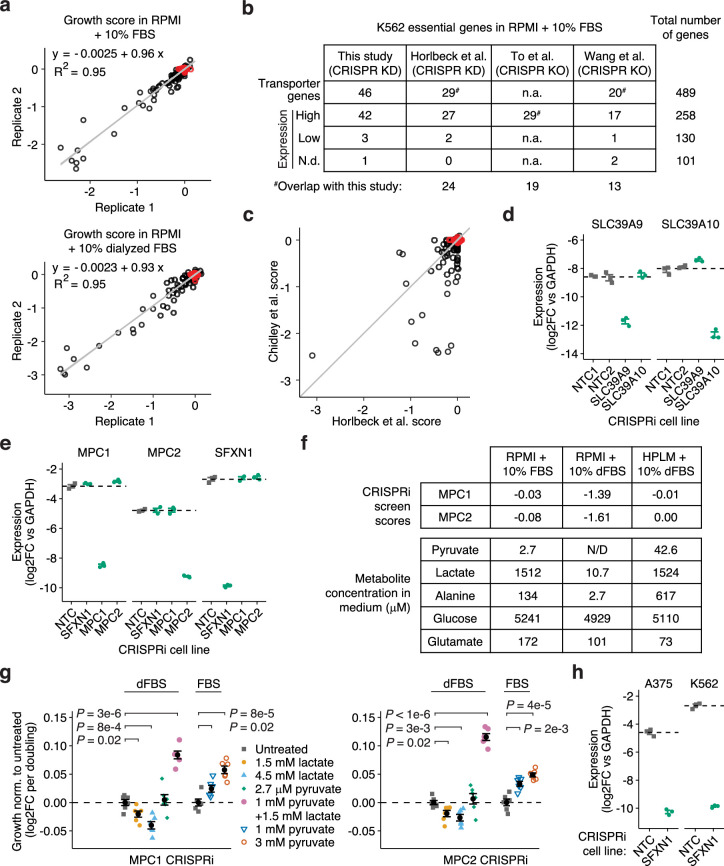
Extended Data Fig. 7. Transporter essentiality across conditions.
(a) CRISPRi transporter screens are highly reproducible as shown by the strong correlation of screen scores between independent replicates. Black circles represent individual transporter genes and red circles indicate computed negative control pseudogenes assembled from non-targeting control (NTC) sgRNAs. (b) Comparison of essential transporter genes identified in this study to previous screens in K562 cells grown in RPMI. The strong enrichment in expressed genes (98%) amongst the essential transporters in this study highlights the quality of the dataset. Essential transporters were determined by using a significance cutoff of q-value < 0.05 (ref. 37), and p < 0.05 and CS score negative73 for the two CRISPRko screens (KO: knockout), and the first negative control gene for the genome-wide CRISPRi screen34 (KD: knockdown). Genes were binned by expression level using publicly available data37. (c) Pairwise comparison of transporter growth scores determined in this study and in a genome-wide CRISPRi screen34 in the same cell line, medium, and using the same gRNA library. (d,e) Transporter expression levels in K562 CRISPRi cell lines determined by RT-qPCR and relative to the housekeeping gene GAPDH (n = 3 technical replicates. Data are mean ± s.e.m.). (f) Growth scores of K562 MPC1 and MPC2 CRISPRi determined in screens in different media and the concentration of a selection of metabolites in those media. Screen scores are from Figs. 5c, 6c and metabolite levels are from published data22. (g) Addition of pyruvate to RPMI + FBS or RPMI + dialyzed FBS (dFBS) alleviates the growth defect induced by CRISPRi of MPC1 or MPC2, and addition of lactate to RPMI + dFBS worsens the growth defect. Assays were performed as in Fig. 5g and data were normalized to untreated samples. n = 6 biologically independent samples. Data are mean ± s.e.m. P values were determined using two-tailed unpaired Student’s t-tests. (h) Expression level of SFXN1 in K562 and A375 CRISPRi cell lines determined by RT-qPCR and relative to GAPDH (n = 3 technical replicates. Data are mean ± s.e.m.). Source numerical data are available in source data.

