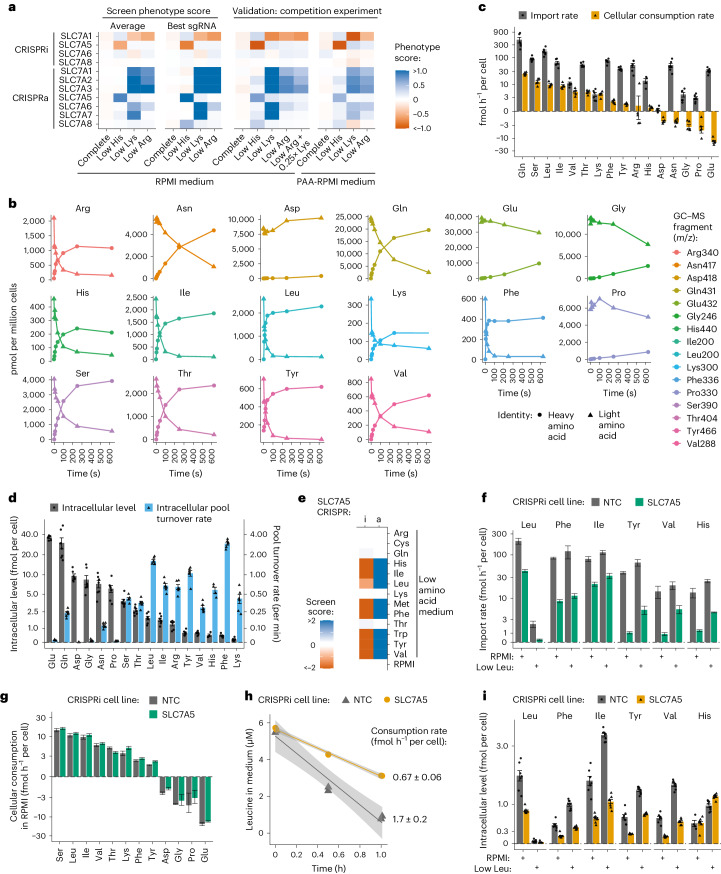
Fig. 2. Measurement of amino acid transport rates in K562 cells reveals that CRISPRi of SLC7A5 specifically reduces transport of large neutral amino acids.
a, The phenotype scores obtained in transporter CRISPRi/a screens for SLC7 family genes were validated in competition assays in K562 cells in RPMI and in RPMI with amino acids adjusted to human plasma levels (PAA-RPMI). b, The import of amino acids into K562 cells in RPMI was determined by quantifying the intracellular accumulation of stable heavy-isotope-labelled amino acids over time by GC–MS. One example representative of six independent experiments. c, Amino acid import and cellular consumption rates of K562 cells growing in RPMI. Import rates were determined by linear regression of the early phase of heavy-isotope-labelled amino acid accumulation. Consumption rates were determined by linear regression of amino acid levels in the growth medium of K562 cells over time. n = 6 biologically independent samples for import and n = 5 for consumption. Data are mean ± s.e.m. d, Intracellular amino acid levels (n = 7 biologically independent samples) and pool turnover rates of K562 cells growing in RPMI. Pool turnover rates were inferred by dividing amino acid import rates in c by intracellular levels. Data are mean ± s.e.m. e, Screen scores for K562 SLC7A5 CRISPRi/a. f, Amino acid import rates for K562 SLC7A5 and non-targeting control (NTC) CRISPRi in RPMI and in low leucine. Data represent the slope ± SE determined from the linear regression of n = 7 biologically independent samples. g, Cellular consumption rates for K562 SLC7A5 and NTC CRISPRi in RPMI. h, Consumption of leucine from low-leucine medium by K562 SLC7A5 and NTC CRISPRi cells. In g and h, the data represent the slope ± SE determined from the linear regression of n = 6 biologically independent samples. The shaded area represents 95% confidence interval. i, Intracellular amino acid levels of K562 SLC7A5 and NTC CRISPRi cells growing in RPMI or in low leucine (n = 8 biologically independent samples; data are mean ± s.e.m.). Source numerical data are available in Source data.

