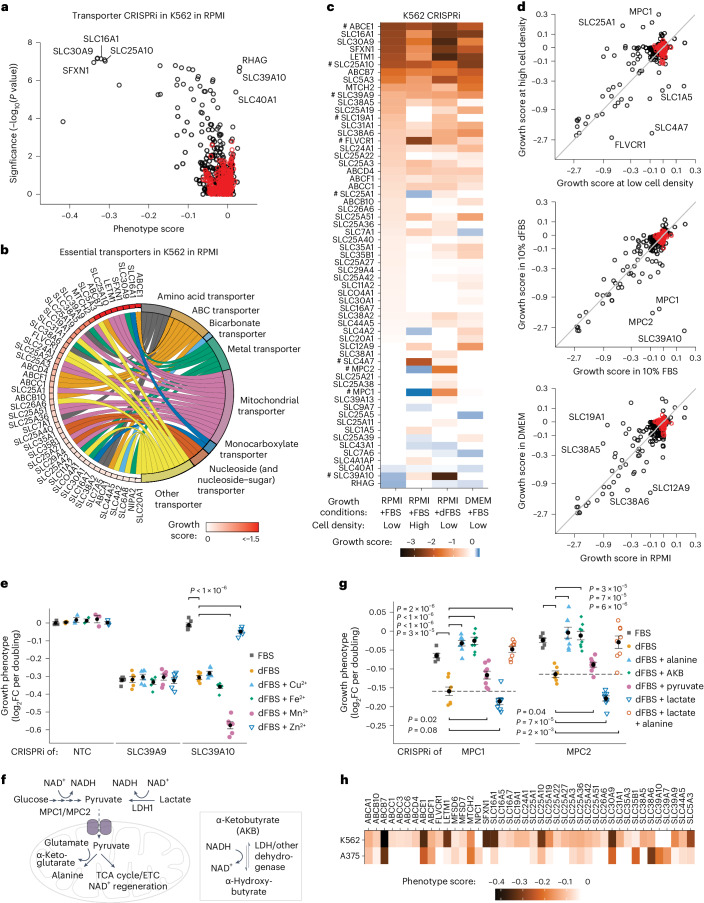
Fig. 5. Transporter essentiality is highly condition specific, which can be leveraged to decipher transporter function.
a, Essential transporters in K562 cells growing in RPMI determined using CRISPRi screening. n = 2 screens each with two technical replicates. P values were determined using a Mann–Whitney test. b, A chord plot displaying all essential transporters from a. c, A tile plot of growth scores determined in CRISPRi screens in K562 cells across culture conditions (n = 2 replicates). All transporters significantly enriched or depleted in at least one condition are included. ‘#’ highlights transporters discussed in the main text. d, A comparison of essentiality between conditions. Data represent growth scores for all transporters as determined in c. e, Growth complementation assays identifying SLC39A10 as the main zinc importer in K562 cells and manganese as a competing ion. Phenotypes were determined in RPMI + FBS, in RPMI + dFBS or in RPMI + dFBS supplemented with 10 μM metal ion. Data are mean ± s.e.m. of three technical replicates for non-targeting control (NTC) and three technical replicates of two biological replicates for SLC39A9 and SLC39A10. f, A cartoon illustrating the role of the mitochondrial pyruvate carrier (MPC1/MPC2) and the major sources and uses of cytoplasmic and mitochondrial pyruvate. Exogenous AKB was used to restore NAD+ levels. ETC, electron transport chain. g, The addition of either alanine or of molecules restoring NAD+ levels alleviates the defect of MPC1/2 CRISPRi. Phenotypes were determined in competition assays in RPMI + FBS and in RPMI + dFBS with 130 μM alanine, 1 mM AKB, 1 mM pyruvate, 4.5 mM lactate or 130 μM alanine + 4.5 mM lactate. Data are mean ± s.e.m. of two biological replicates each with three technical replicates. Horizontal dashed lines highlight the growth phenotype in the ‘+dFBS’ condition. h, A comparison of transporter essentiality in K562 and A375 cells. Data (n = 2 replicates) are the phenotype scores determined in CRISPRi screens in RPMI for all transporters significantly depleted in at least one cell line. In a and d, black circles indicate transporter genes and red circles indicate negative control genes. In e and g, P values were determined using two-tailed unpaired Student’s t-tests. Source numerical data are available in Source data.

