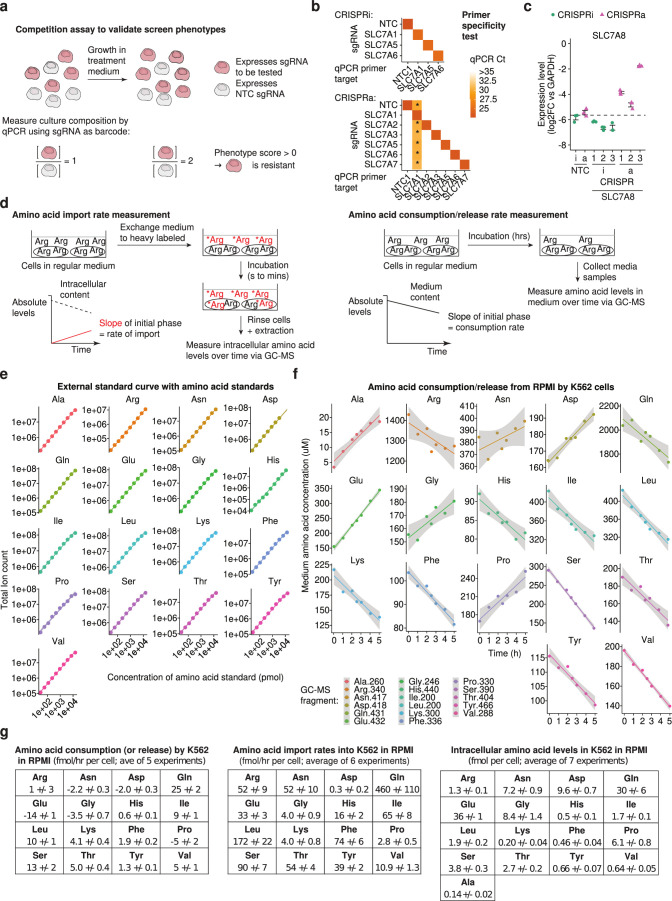
Extended Data Fig. 3. Measurement of amino acid import and consumption rates in K562 cells.
(a) A cartoon illustrating the competition assay used to validate growth phenotypes of CRISPRi/a cell lines. A CRISPRi/a cell line expressing a test sgRNA is mixed at a 1:1 ratio with a cell line expressing a non-targeting control (NTC) sgRNA. Cell line ratios pre- and post-treatment are determined by qPCR on gDNA extracted from cultures using primers specific to the sgRNA. Phenotype scores are determined by normalizing enrichments by the difference in population doublings. (b) Confirmation of the specificity of primers targeting sgRNAs in qPCR assays. gDNA extracted from K562 CRISPRi/a cells was amplified by qPCR with primers targeting specific and NTC sgRNA barcodes. Data are the cycle threshold (Ct) value of a representative experiment. Asterisks represent non-specific product amplification. (c) SLC7A8 expression level in K562 SLC7A8 CRISPRi/a cells determined by RT-qPCR relative to the housekeeping gene GAPDH. n = 3 technical replicates. Data are mean ± s.e.m. (d) Cartoons illustrating amino acid import and consumption rate determination. The medium surrounding K562 cells attached to the surface of a Petri dish is rapidly exchanged to a similar medium where amino acids are heavy-isotope labelled. After extensive washing with PBS, intracellular metabolites are extracted and light and heavy amino acid levels are quantified by GC-MS. Import rates are determined from the slope of the increase in heavy amino acids over time. For consumption rate determination, the medium surrounding K562 cells is exchanged to fresh unlabelled medium and media samples are taken over time. Amino acid levels in samples are determined by GC-MS, and consumption rates are determined by the slope of the change in levels over time. (e) External standard curve used to calculate absolute levels of amino acids. Representative example of two independent experiments (f) Representative example of amino acid consumption from the medium of K562 cells growing in RPMI. Data (n = 7 biologically independent samples) were fit to a linear model and the shaded area represents 95% CI. (g) Numerical values of data displayed in Fig. 2c,d. Source numerical data are available in source data.

