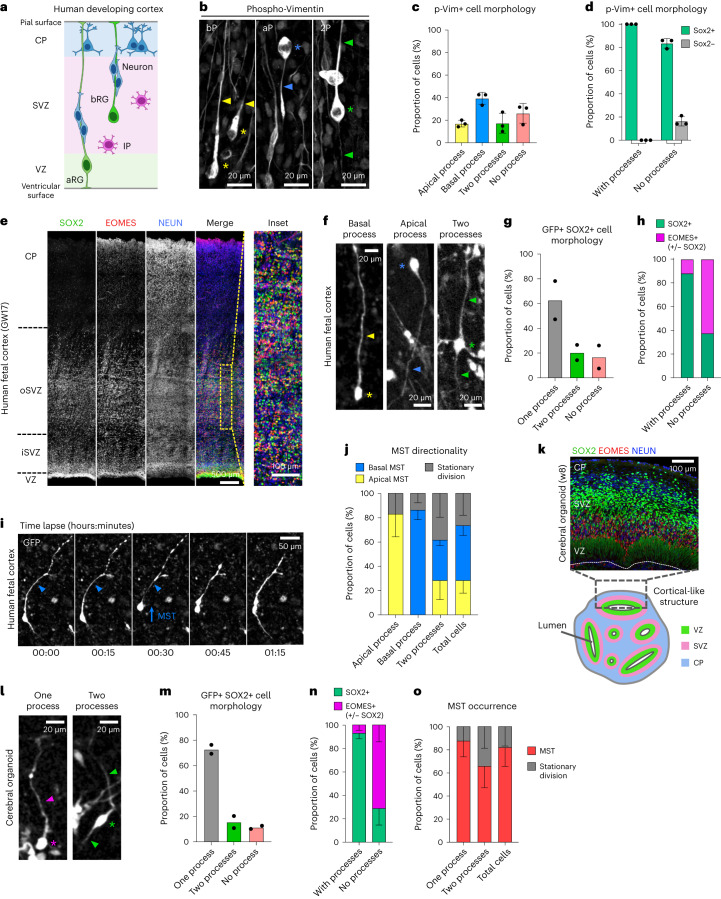
Fig. 1. Morphological characterization of bRG cells in human cerebral organoids and fetal tissue.
a, Schematic representation of human neocortex development. CP, cortical plate. b, Phospho-Vimentin immunostaining of human frontal cortex at GW 18. Image is overexposed to visualize processes, revealing cells with basal process (bP), apical process (aP) and both processes (2P). c, Quantification of mitotic bRG cell morphologies in GW 14–18 frontal cortex. N = 3 brains, 338 cells. d, Proportion of p-VIM+ cells positive for SOX2, depending on morphology. N = 3 brains, 456 cells. e, SOX2, EOMES and NEUN immunostaining in human frontal cortex at GW 17. f, Morphologies of GFP-expressing SOX2+ cells in human frontal cortex at GW 17. g, Quantification of morphologies of GFP-expressing SOX2+ cells in human frontal cortex at GW 14–17. N = 2 brains, 350 cells. h, Proportion of SOX2+/EOMES– and EOMES+ (with or without SOX2) progenitors, depending on morphology in human frontal cortex at GW 14–17. N = 2 brains, 204 cells. i, Live imaging of bRG cell performing MST in human fetal tissue. The arrowhead indicates basal process. j, Directionality of MST depending on bRG cell morphology in human frontal cortex at GW 14–18. N = 3 brains, 242 cells. k, SOX2, EOMES and NEUN immunostaining in week 8 cerebral organoids (top). Schematic representation of week 8–10 cerebral organoids (bottom). l, Morphologies of GFP-expressing SOX2+ cells in cerebral organoids at weeks 7–10. m, Quantification of morphologies of GFP-expressing SOX2+ cells in cerebral organoids at weeks 7–8. N = 2 batches, 104 cells. n, Proportion of SOX2+/EOMES– and EOMES+ (with or without SOX2) progenitors, depending on morphology in cerebral organoids at weeks 8–10. N = 3 batches, 205 cells. o, Directionality of MST depending on bRG cell morphology cerebral organoids at weeks 8–9. N = 4 batches, 260 cells. Arrowheads indicate bRG processes and asterisks indicate soma. Data are presented as mean values +/− s.d.

