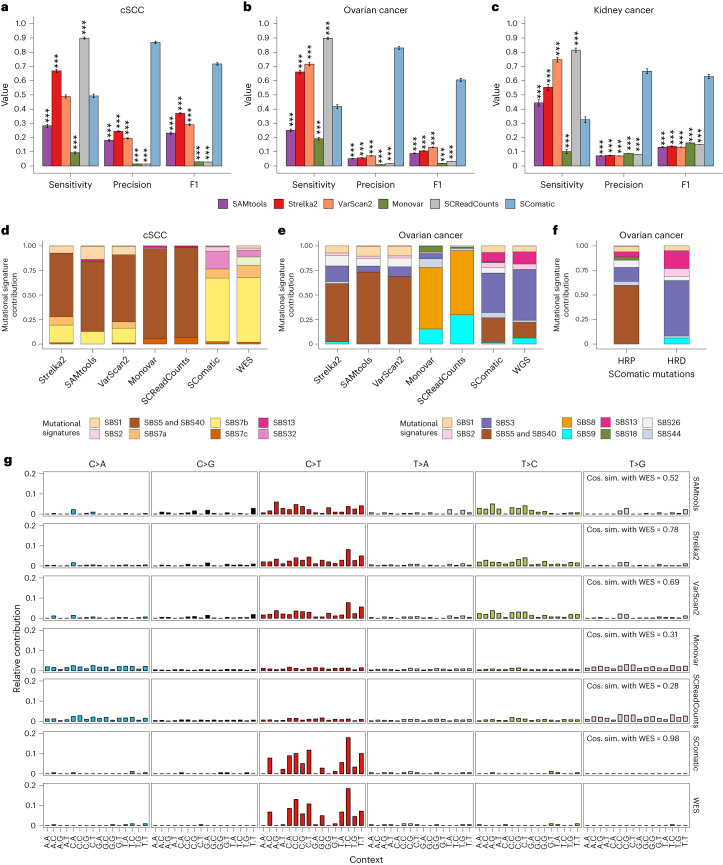
Fig. 3. Comparison of the performance of SComatic against other mutation detection methods.
a–c, Performance of Strelka2, SAMtools, VarScan2, Monovar, SCReadCounts and SComatic for the detection of somatic mutations in the scRNA-seq data from cSCC (a), ovarian cancer (b) and kidney tumor samples (c). The bars represent the mean value, and the error bars are the 95% bootstrap confidence interval for each statistic computed using 50 bootstrap resamples. Significance with respect to SComatic in a–c was assessed using the two-sided Student’s t-test (***P < 0.0001). d, Decomposition into COSMIC signatures of the mutations detected in cSCC scRNA-seq data and in matched WES data. e, Decomposition into COSMIC signatures of the mutations detected in scRNA-seq and matched WGS data from ovarian cancer samples. f, Decomposition into COSMIC signatures of the mutations detected by SComatic in scRNA-seq from homologous recombination deficient (HRD) and homologous recombination proficient (HRP) ovarian cancer samples. g, Comparison between the mutational spectra of the mutations detected in cSCC samples using WES and scRNA-seq data for the algorithms benchmarked. The cosine similarities between the mutational spectra computed using the mutations detected in the scRNA-seq and the WES data are shown.

