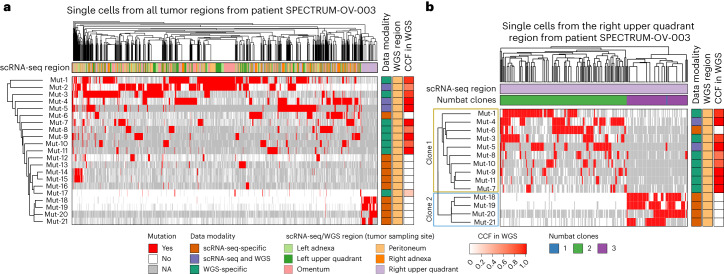
Fig. 6. Analysis of intra-tumor heterogeneity using somatic mutations detected by SComatic in the scRNA-seq data from a patient with ovarian cancer (SPECTRUM-OV-003).
a, Hierarchical clustering of single cells from all tumor regions (columns) by somatic mutations (rows; mutations are labeled arbitrarily). Mutations detected in the scRNA-seq data are shown in red. White denotes the absence of mutations in the scRNA-seq data in cases when the site was sufficiently covered (at least one sequencing read), and gray indicates that there was no coverage at the position to make a call. b, Hierarchical clustering of single cells collected from the upper right quadrant region from patient SPECTRUM-OV-003. Only the mutations shown in a that were detected in at least 20 cells are shown. The two clones defined by somatic mutations detected in scRNA-seq data are marked on the y axis. Single cells and mutations in a and b are ordered by hierarchical clustering (top and left-hand side dendrograms, respectively). The color bar indicates the cancer cell fraction (CCF) of the mutations in the WGS data. NA, no coverage in scRNA-seq.

