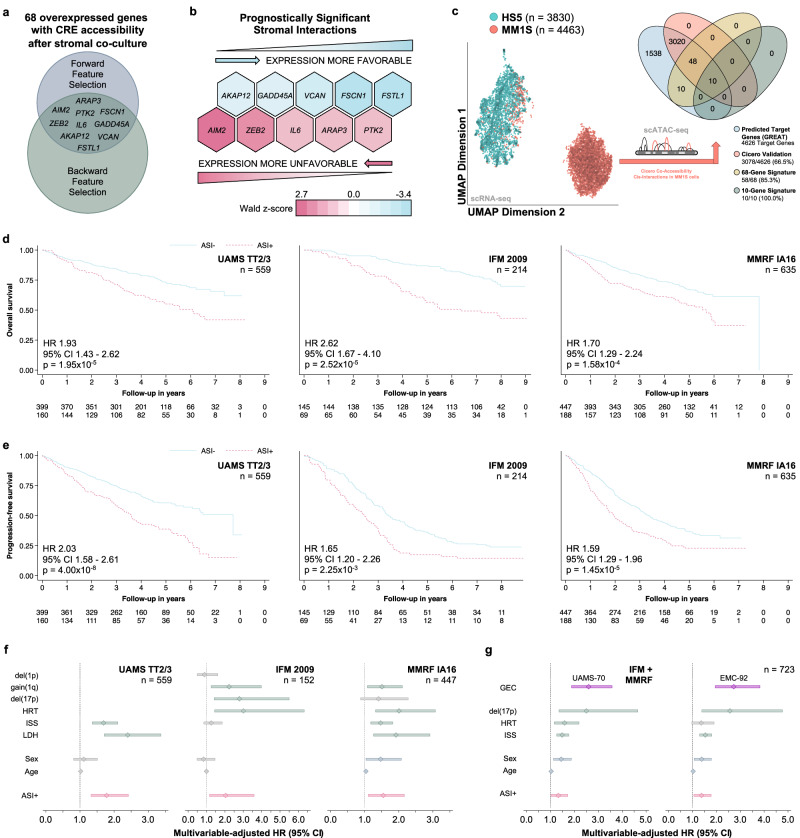
Fig. 3. The expression of stromal interaction genes is of independent prognostic significance in myeloma and defines a high-risk subgroup of patients with distinct transcriptomic features.
a Venn diagram showing the subset of genes independently associated with progression-free survival in patients with newly diagnosed myeloma (UAMS TT2/3, n = 559, GSE24080). The consensus of forward and backward feature selection in proportional hazards regression models identified 10 genes that were selected for further study based on their independent prognostic significance. b Heatmap showing the direction and effect sizes for the 10 genes independently associated with progression-free survival in UAMS TT2/3. The expression of half of the genes was associated with increased progression-free survival, the expression of the other half with decreased progression-free survival. The color gradient reflects the Wald z-score of the regression coefficient for each gene in the multivariable-adjusted proportional hazards regression model (a normalized measure of the effect size). c Scatter plot (left) showing the separation of HS5 (turquoise) and MM1S (orange) cells after co-culture in two-dimensional UMAP space based on their single-cell gene expression profiles. Euler diagram (right) showing the validation the predicted cis-interactions in MM1S cells after co-culture with HS5 using single-cell co-accessibility analysis. d Kaplan-Meier plots showing the association between the presence of adverse stromal interactions (ASI + ) and overall survival (Wald test). e Kaplan-Meier plots showing the association between the presence of adverse stromal interactions (ASI + ) and progression-free survival (Wald test). f Forest plots demonstrating the independent prognostic significance (overall survival) of the presence of adverse stromal interactions (ASI + ) in the derivation cohort and the two validation cohorts, when adjusting for established clinical, laboratory, and cytogenetic high-risk markers. The center marker represents the hazard ratio (HR) and the bars the corresponding 95% confidence interval. g Forest plots demonstrating the independent prognostic significance (overall survival) of the presence of adverse stromal interactions (ASI + ) in the combined validation cohorts when adjusting for the established clinical, laboratory, as well as the UAMS-70 and EMC-92 high-risk gene expression classifier, respectively. Center marker and bars same as for (f). Source data are provided as a Source Data file.

