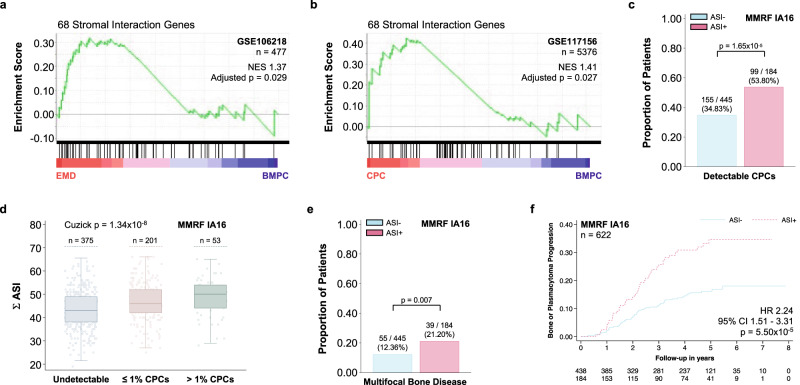
Fig. 6. Adverse stromal interactions cause a transcriptomic program that is akin to the gene expression profile of extramedullary disease (EMD) and are associated with accelerated disease dissemination.
a Gene Set Enrichment Analysis demonstrating the concordant expression of the 68 overexpressed genes with de novo chromatin accessibility in their associated cis-regulatory elements (see b) in 303 malignant extramedullary plasma cells (obtained from malignant ascites and pleural effusions) compared to 177 malignant bone marrow plasma cells (BMPCs) from the same patient population (GSE106218; permutation test, p value adjusted for multiple comparisons using family-wise error correction). b Gene Set Enrichment Analysis demonstrating the concordant expression of the same 68 genes in 2688 circulating plasma cells (CPCs) compared to 2688 BMPCs from the same population (permutation test, p value adjusted for multiple comparisons using family-wise error correction). c Bar graphs showing the distribution of patients with detectable CPCs by flow cytometry at the time of diagnosis in the stratified by ASI+ (Fisher’s exact test). d Box and strip plots demonstrating an increase in detectable CPCs with a greater extent of adverse stromal interactions (Σ ASI; Mann–Whitney U test). e Bar graphs showing the distribution of patients with imaging findings of multiple disseminated bone lesions at the time of diagnosis stratified by ASI+ (Fisher’s exact test). f Kaplan-Meier plot showing the association of the presence of adverse stromal interactions (ASI + ) with the development of new bone lesions or soft tissue plasmacytomas during follow-up (or increase in the size of existing bone lesions or soft tissue plasmacytomas; Wald test). This association remained consistent after adjusting for age, sex, ISS, LDH, HRT, −17p, and +1q (HR 2.18, 95% CI 1.35–3.51, p = 0.001, n = 442). There was no evidence for violations of the proportional hazards assumption (p = 0.212)71. Data are presented as standard Tukey boxplots (with the box encompassing Q1 to Q3, the median denoted as a central horizontal line in the box, and the whiskers covering the data within ±1.5 IQR in d).

