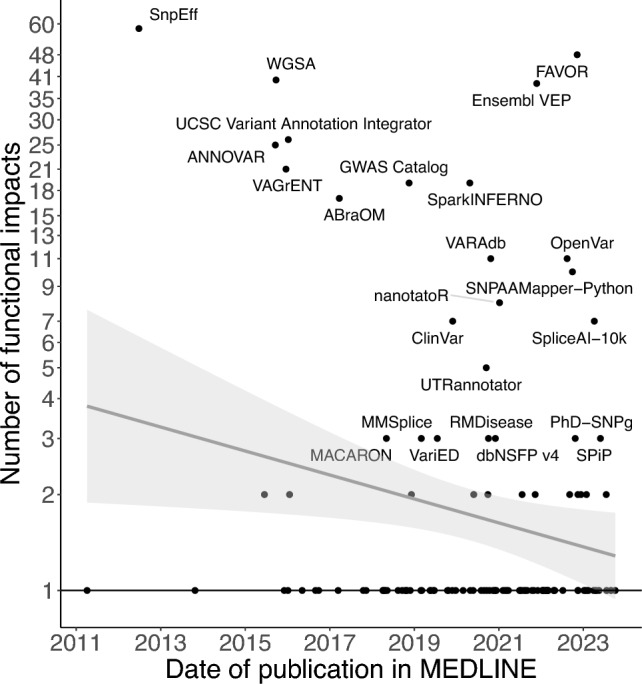
Fig. 4.

Number of predicted functional impacts annotated by each tool over time. Tools with ≥ 3 predictions are labeled. The x-axis shows the day of publication in MEDLINE. The y-axis shows the number of predicted functional impacts in the most recent version of the tool. The grey line represents the least squares regression line. The light grey shaded area surrounding this line represents the 95% pointwise confidence intervals. The flat black line represents the quantile regression line at the median
