Fig. 2.
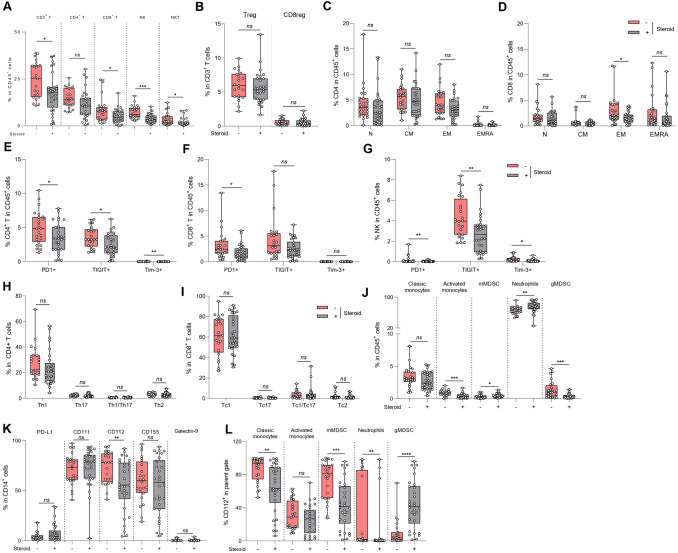
Influence of steroid usage peripheral blood immune phenotyping and serum cytokines in GBM patients. Blood samples from baseline glioblastoma patients were activated or not, stained and then analyzed by flow cytometry. Patients were distinguished according to the presence (n = 30) or the absence (n = 20) of steroid treatment at baseline (a-l). A Box plot showing the percentage of different lymphoid populations in CD45+ cells: CD4+ T cells (CD45+ CD3+ CD4+), CD8+ T cells (CD45+ CD3+ CD8+), Natural Killer (NK) cells (CD45+ CD3− CD56+) and Natural Killer T (NKT) cells (CD45+ CD3+ CD56+) according to patients’ steroid treatment. B Box plot showing the frequency of regulatory CD4 T cells (CD4+ Foxp3+) and regulatory CD8 T cells (CD8+ Foxp3+) in lymphocytes T CD3+ according to patients’ steroid treatment. C Box plot showing the proportion of different stages of CD4 T cell differentiation in CD45+ cells: naïve cells « N» (CD4+ CD45RA+ CCR7+), effector memory cells « EM» (CD4+ CD45RA− CCR7−), central memory cells « CM» (CD4+ CD45RA− CCR7+) and effector memory cells re-expressing CD45RA « EMRA» (CD4+ CD45RA+ CCR7−) according to patients’ steroid treatment. D Box plot showing the proportion of different stages of CD8 T cell differentiation in CD45+ cells: naïve cells « N» (CD4+ CD45RA+ CCR7+), effector memory cells « EM» (CD4+ CD45RA− CCR7−), central memory cells « CM» (CD4+ CD45RA− CCR7+) and effector memory cells re-expressing CD45RA « EMRA» (CD4+ CD45RA+ CCR7−) according to patients’ steroid treatment. E–G Box plot showing the percentage of CD4+ T (E), CD8+ T (F) or NK (G) cells expressing 3 immune checkpoints PD-1, TIGIT or Tim-3 according to patients’ steroid treatment. H Box plot showing the proportion of different CD4 T cell subpopulations in CD4+ cells: Th1 (CD4+ FoxP3− IFNγ+ IL-17A−), Th17 (CD4+ FoxP3− IFNγ− IL-17A+), Th1/17 (CD4+ FoxP3− IFNγ+ IL-17A+) and Th2 (CD4+ FoxP3− IFNγ− IL-17A− IL-4+) cells according to patients’ steroid treatment. I Box plot showing the proportion of different CD8 T cell subpopulations in CD8+ cells: Tc1 (CD8+ FoxP3− IFNγ+ IL-17A−), Tc17 (CD8+ FoxP3− IFNγ− IL-17A+), Tc1/17 (CD8+ FoxP3−IFNγ+ IL-17A+) and Tc2 (CD8+ FoxP3− IFNγ− IL-17A− IL-4+) cells according to patients’ steroid treatment. J Box plot showing the frequency of myeloid subpopulations in CD45+ cells: classical monocytes (CD11b+ CD15− CD14+ HLA-DR+), activated monocytes (CD11b+ CD15− CD14low HLA-DR+), monocytic MDSC (CD11b+ CD15− CD14+ HLA-DRlow), neutrophils (CD11b+ CD15+ CD14−) and granulocytic MDSC (CD11b+ CD15+ CD14+) according to patients’ steroid treatment. K Box plot showing the frequency of PD-L1+, CD111+, CD112+, CD155+ and Galectin-9+ populations within monocytes (CD14+) according to patients’ steroid treatment. L Box plot showing the frequency of CD112+ among the following myeloid subtypes: classical monocytes, activated monocytes, mMDSC, neutrophils and gMDSC according to patients’ steroid treatment. Statistical analysis was performed using an unpaired Mann–Whitney Wilcoxon test. n.s, not significant; *p < 0.05, **p < 0.01, ***p < 0.001, ****p < 0.0001

