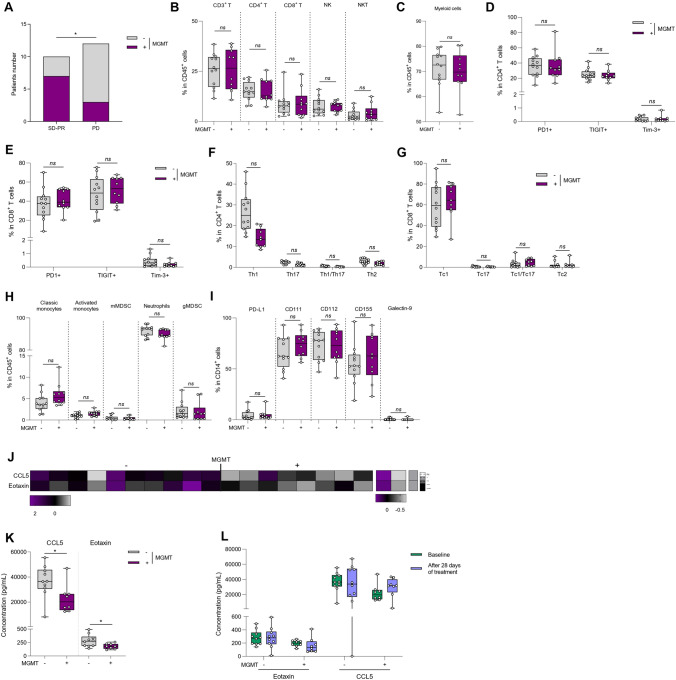
Fig. 3.
Influence of MGMT status on peripheral blood immune phenotyping. Blood samples from baseline glioblastoma patients were activated or not, stained and then analyzed by flow cytometry. Patients were distinguished according to the methylation (n = 10) or the absence of methylation (n = 12) of the MGMT promoter. A Bar plots showing the number of patients with stable disease or partial response (SD + PR) or progressive disease (PD) according to the methylation status of the MGMT promoter (+ : methylation of MGMT; −: absence of methylation of MGMT). *p < 0.05, comparison using Chi-square test. B Box plot showing the frequency of different lymphoid populations in CD45+ cells: CD4+ T cells (CD45+ CD3+ CD4+), CD8+ T cells (CD45+ CD3+ CD8+), Natural Killer (NK) cells (CD45+ CD3− CD56+) and Natural Killer T (NKT) cells (CD45+ CD3+ CD56+) according to MGMT promoter status. C Box plot showing the percentage of myeloid cells (CD11b+) in CD45+ cells according to the status of MGMT promoter. D, E Box plot showing the percentage of CD4+ T (D) or CD8+ T (E) cells expressing 3 immune checkpoints PD-1, TIGIT or Tim-3 according to MGMT methylation status. F Box plot showing the proportion of different CD4 T cell subpopulations in CD4+ cells: Th1 (CD4+ FoxP3− IFNγ+ IL-17A−), Th17 (CD4+ FoxP3− IFNγ− IL-17A+), Th1/17 (CD4+ FoxP3− IFNγ+ IL-17A+) and Th2 (CD4+ FoxP3− IFNγ− IL-17A− IL-4+) cells according to MGMT methylation status. G Box plot showing the proportion of different CD8 T cell subpopulations in CD8+ cells: Tc1 (CD8+ FoxP3− IFNγ+ IL-17A−), Tc17 (CD8+ FoxP3− IFNγ− IL-17A+), Tc1/17 (CD8+ FoxP3−IFNγ+ IL-17A+) and Tc2 (CD8+ FoxP3− IFNγ− IL-17A− IL-4+) cells according to MGMT methylation status. H Box plot showing the frequency of myeloid subpopulations in CD45+ cells: classical monocytes (CD11b+ CD15− CD14+ HLA-DR+), activated monocytes (CD11b+ CD15− CD14low HLA-DR+), monocytic MDSC (CD11b+ CD15− CD14+ HLA-DRlow), neutrophils (CD11b+ CD15+ CD14−) and granulocytic MDSC (CD11b+ CD15+ CD14+) according to MGMT methylation status. I Box plot showing the frequency of PD-L1+, CD111+, CD112+, CD155+ and Galectin-9+ populations within monocytes (CD14+) according to patients’ steroid treatment. J Cytokine secretion in patient plasma according to MGMT methylation status was analyzed using a bioplex technique. The heatmap on the left corresponds to normalized cytokine expression (z-score) for which there is a statistically significant difference between patients, the heatmap in the middle corresponds to the median for each cytokine for each of the two populations studied and the column on the right is the p-value of statistical analysis using one-way ANOVA. K Box plot showing the concentration in pg/mL of each of the cytokines whose Z-Score is significantly different between patients according to MGMT methylation status. L Box plots of the soluble Eotaxin and CCL5 assay in the plasma of patients at C1 (baseline), and C3 (after 28 days of treatment) according to MGMT methylation status. Statistical analysis was performed using an unpaired Mann–Whitney Wilcoxon test. n.s, not significant; *p < 0.05

