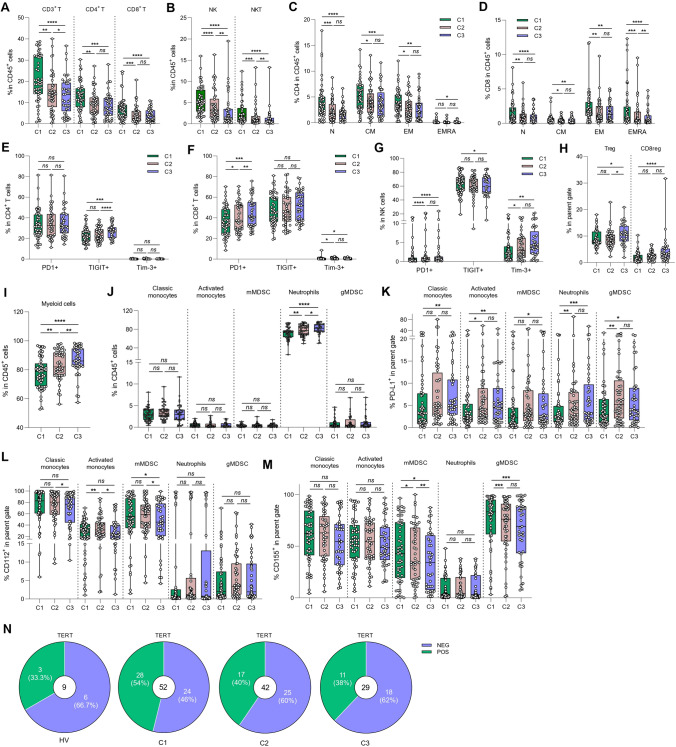
Fig. 4.
Evolution of immune parameter during therapy. Blood samples from glioblastoma patients were recovered at baseline (C1) (n = 54), 21 days (C2) (n = 46) and 35 days (C3) (n = 41) after the start of treatment and were activated or not, stained and then analyzed by flow cytometry. A Box plot showing the evolution of the percentage of different lymphoid populations in CD45+ cells: CD4+ T cells (CD45+ CD3+ CD4+) and CD8+ T cells (CD45+ CD3+ CD8+) during treatment. B Box plot showing the evolution of the percentage of different lymphoid populations in CD45+ cells: Natural Killer (NK) cells (CD45+ CD3− CD56+) and Natural Killer T (NKT) cells (CD45+ CD3+ CD56+) during treatment. C, D Box plot showing the evolution of the proportion of different stages of CD4 (C) or CD8 (D) T cell differentiation in CD45+ cells: naïve cells «N» (CD4+ CD45RA+ CCR7+), effector memory cells «EM» (CD4+ CD45RA− CCR7−), central memory cells « CM» (CD4+ CD45RA− CCR7+) and effector memory cells re-expressing CD45RA «EMRA» (CD4+ CD45RA+ CCR7−). E–G Box plot showing the evolution of the percentage of CD4+ T (E), CD8+ T (F) or NK (G) cells expressing 3 immune checkpoints PD-1, TIGIT or Tim-3 during treatment. H Box plot showing the evolution of the frequency of regulatory CD4 T cells (CD4+ Foxp3+) and regulatory CD8 T cells (CD8+ Foxp3+ ) in lymphocytes T CD3+. I Box plot showing the evolution of the percentage of myeloid cells (CD11b+) in CD45+ cells during treatment. J Box plot showing the evolution of the frequency of myeloid subpopulations in CD45+ cells: classical monocytes (CD11b+ CD15− CD14+ HLA-DR+), activated monocytes (CD11b+ CD15− CD14low HLA-DR+), monocytic MDSC (CD11b+ CD15− CD14+ HLA-DRlow), neutrophils (CD11b+ CD15+ CD14−) and granulocytic MDSC (CD11b+ CD15+ CD14+) during treatment. K–M Box plot showing the frequency of PD-L1+ (K), CD112+ (L) or CD155+ (M) among the following myeloid subtypes: classical monocytes, activated monocytes, mMDSC, neutrophils and gMDSC during treatment. N Parts of whole (purple and green) showing the percentage of positive (in green) or negative (in purple) antitumor responses against TERT in healthy volunteers (n = 9) and in patients at C1 (n = 52), C2 (n = 42) and C3 (n = 29). Statistical analysis was performed using an unpaired Mann–Whitney Wilcoxon test. n.s, not significant; *p < 0.05, **p < 0.01, ***p < 0.001, ****p < 0.0001

