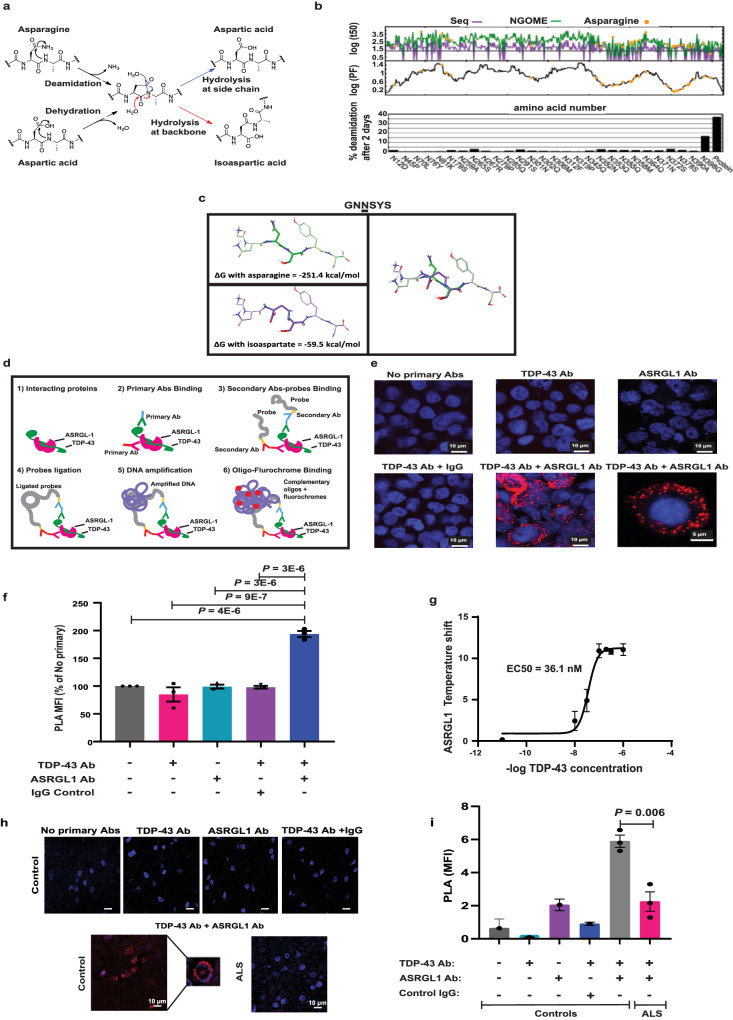
Fig. 3. TDP-43 is predicted to form isoaspartates through asparagine deamidation and TDP-43 interacts with ASRGL1.
a Spontaneous formation of isoaspartate by asparagine deamidation or aspartate isomerization. b Prediction of TDP-43 asparagine deamidation under physiological conditions using the NGOME algorithm81. Top panel: Predicted deamidation half-lives (time point at which the residue is deaminated in 50%) considering sequence propensities (purple line) and sequence propensities + structural protection (green line). Orange circles highlight actual asparagine residues; the lines are the predictions for all positions of the query sequence81. Middle panel: Structure protection factor (PF) as a function of residue number81. Bottom panel: Percentage of deamidation predicted for asparagine residues after 2 days. c Example of 3D modeling of a TDP-43 peptide with isoaspartate substitution in a “hot spot” predicted by NGOME-Lite, showing the variation in the Gibbs free energy values, indicative of thermodynamic instability. d Diagram explaining Proximity ligation assay (PLA). e, f PLA was performed in HEK 293 cells transfected with ASRGL1 and TDP-43 plasmids and incubated with antibodies: no primary, only TDP-43, only ASRGL1, TDP-43 + IgG and ASRGL1 + TDP-43. e Representative PLA images of HEK 293 cells transfected with ASRGL1 and TDP-43 plasmids and incubated with ASRGL1 + TDP-43 antibodies and controls. f Comparison of percentage of PLA mean fluorescence intensity (PLA MFI) in relation with “No primary” control. (Brown-Forsythe ANOVA test/Bonferroni correction; Mean ± SEM; number of experimental replicates = 3). g Interaction of ASRGL-1 with TDP43 (recombinant proteins) using thermal shift assays. Tm value was calculated from the derivative of the thermal melt curves (Sigmoidal, Four-parameter logistic curve (4PL); Mean (95% CI); number of experimental replicates = 3). h, i PLA was performed in brain samples of ALS individuals (n = 3) and normal controls (n = 3) with TDP-43 and ASRGL1 antibodies. Negative controls were performed on a normal control brain since the expression of ASRGL1 is higher in normal controls. h Representative images of PLA in a normal control and an ALS patient brain stained with TDP-43 + ASRGL1 antibodies and the negative controls. i PLA MFI comparison (one-way ANOVA with Bonferroni correction (Mean ± SEM). All pairwise comparisons in the Figure were performed with two-sided tests. Source data are provided as a Source Data file.

