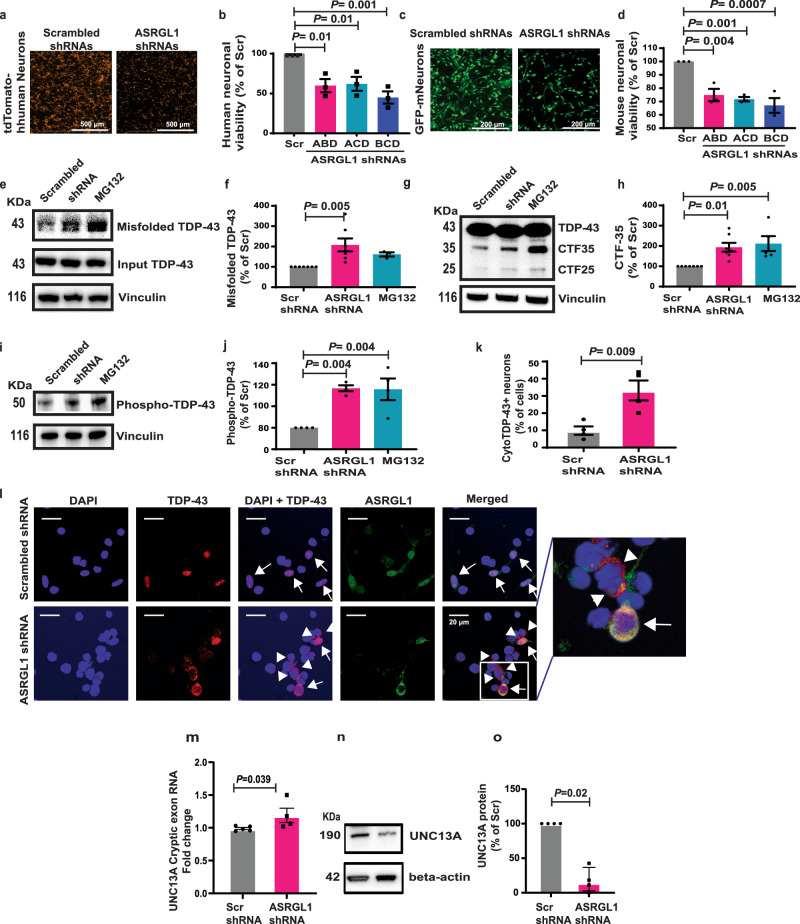
Fig. 4. ASRGL1 silencing causes TDP-43 proteinopathy and neuronal death.
a, b IPSc-derived human neurons (normal donor) line stably expressing tdTomato protein and (c, d) Mouse neurons derived from a commercial neural stem cell line stably expressing GFP were transfected with ASRGL1 shRNAs or scrambled shRNAs. Fluorescent neurons were counted automatically after 48 h. a, c Representative fluorescence microscopy images. b, d Comparison of cellular viability (Percentage of counted cells/field in relation to scrambled shRNAs) (Brown-Forsythe ANOVA test with Bonferroni correction; Mean ± SEM; number of experimental replicates = 3). e, f Misfolded TDP-43 was analyzed in IPSc derived (normal donor) neuronal cultures co-transfected with an intrabody against misfolded TDP-43, full-length TDP-43, and ASRGL1 shRNAs or scrambled shRNAs, by co-immunoprecipitation and western blotting. Proteasome inhibitor MG132 was used as positive control. e Image of a TDP-43 blot. Due to the low levels of misfolded protein, blots were exposed longer. f Comparison of misfolded TDP-43 levels (Brown-Forsythe ANOVA test with Bonferroni correction; Mean ± SEM; number of experimental replicates = 7). g, h Neuronal cultures were transfected with TDP-43 and ASRGL1 shRNAs or scrambled shRNAs and analyzed by western blotting. g Image of a TDP-43 C-terminal fragments (CFT) blot. Due to the low levels of CFTs, blots were exposed longer. h Comparison of CTF levels (Brown-Forsythe ANOVA test with Bonferroni correction; Mean ± SEM; number of experimental replicates = 7). i–o Neuronal cultures were transfected with ASRGL1 shRNAs or scrambled shRNAs and analyzed by western blotting. i Image of a phosphorylated TDP-43 blot. j Comparison of phosphorylated TDP-43 levels (Brown-Forsythe ANOVA test with Bonferroni correction; Mean ± SEM; number of experimental replicates = 4). k Comparison of the percentage of neurons with cytoplasmic TDP-43 (two-sided unpaired T-test; Mean ± SEM. l Confocal microscope images of nuclear TDP-43 (arrows) and TDP-43 cytoplasmic inclusions (arrow heads) in neurons. m RNA levels of UNC13A cryptic exon, by qPCR. n Image of a UNC13A protein blot. o Comparison of UNC13A protein levels in percentage relative to scrambled shRNA transfected cells (Mann–Whitney test; Mean ± SEM; number of experimental replicates = 4). All pairwise comparisons in the Figure were performed with two-sided tests. Source data are provided as a Source Data file.

