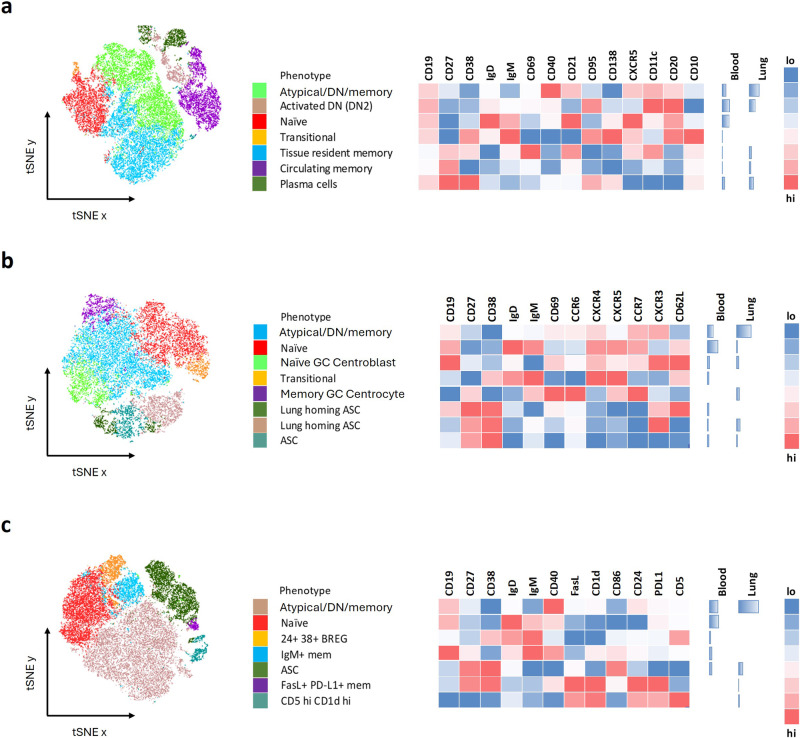
Fig. 5. tSNE plot comparison of B cell phenotypes further refines blood and lung tissue associated compartments.
In order to study the complexity of the B cell phenotypes associated with blood and lung tissue compartments of patients with TB, three separate flow cytometry phenotyping panels were used. a Assesed the level of maturation of the B cells, b the expression of different homing markers and c the relative expression of regulatory markers. The different B cell populations were clustered spatially using tSNE, with a single patient presented here, followed by a key describing the major phenotypes each of which is assigned a different colour. The relative expression of the specific markers associated with each phenotype were plotted alongside in a heatmap. Since the blood and lung samples were concatenated into a single file, the relative frequencies of cells in the blood or lung tissue compartment could be compared as shown alongside the heatmap.

