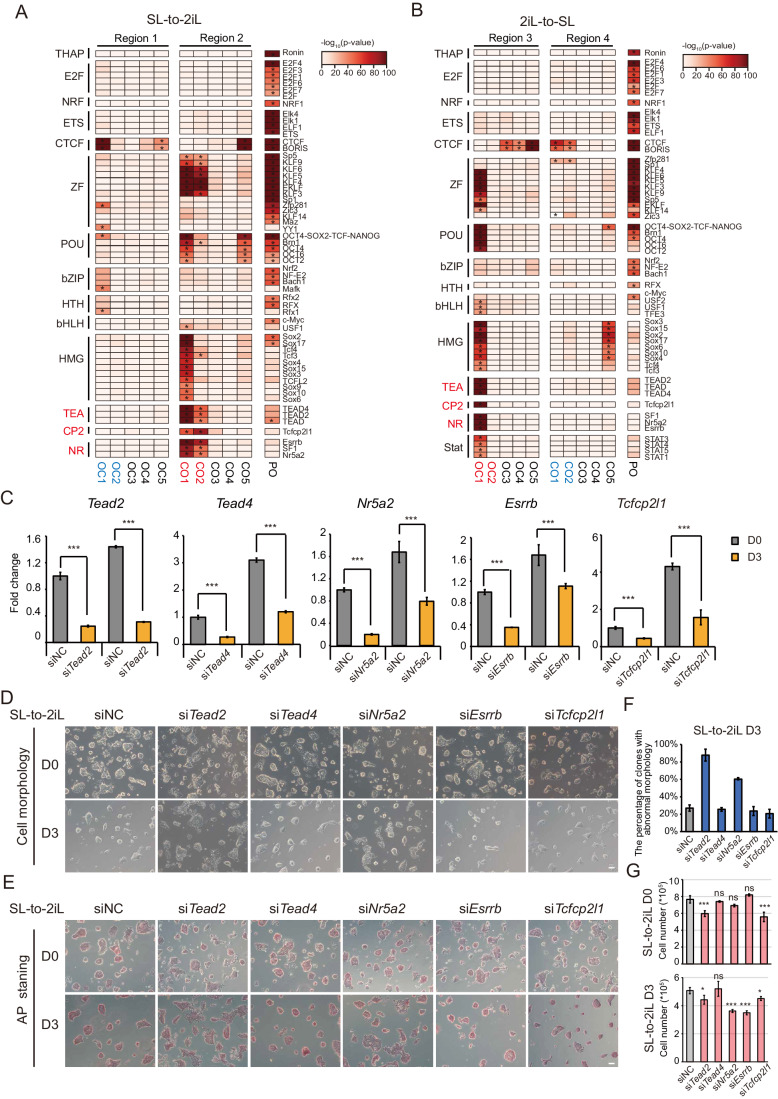
Figure 2. TEAD2 regulates the transition between 2iL-ESCs and SL-ESCs.
(A, B) TF motifs are significantly enriched in CO/OC/PO categories of ATAC-seq peaks during the transition from SL-to-2iL (A) and 2iL-to-SL (B). The motifs for TFs are indicated on the right of the heatmap. *p < 1e−30. P-value was calculated by hypergeometric enrichment calculations from Homer software. (C) RT-qPCR testing siRNA knockdown efficiencies for Tead2, Tead4, Tcfcp2l1, Nr5a2, and Esrrb during SL-to-2iL transition. Cells were treated with specific siRNAs for every 3 days along with control siRNA. Data are shown as the mean ± SD. Indicated significances are tested using Student’s t-test analyses (***p < 0.001). n = 3 biological replicates. (D) Representative images of cells transfected with siNC (negative control) and siRNAs for Tead2, Tead4, Tcfcp2l1, Nr5a2, and Esrrb during the SL-to-2iL process. Scale bar, 100 μm. (E) Representative images of AP staining of cells transfected with siNC (negative control) and siRNAs for Tead2, Tead4, Tcfcp2l1, Nr5a2, and Esrrb during SL-to-2iL process. Scale bar, 100 μm. (F) The percentage of clones with abnormal morphology on day 3 of SL-to-2iL transition in (E). Data are shown as mean ± SD of three independent fields of view. (G) Number of cells transfected with siNC (negative control) and siRNAs of Tead2, Tead4, Tcfcp2l1, Nr5a2, and Esrrb. Cells were grown for 3 days during the SL-to-2iL process. Data are presented as the mean ± SD of three independent wells. Indicated significances are tested using Student’s t-test analyses (*p < 0.05, ***p < 0.001). n = 3 biological replicates. Source data are available online for this figure.

