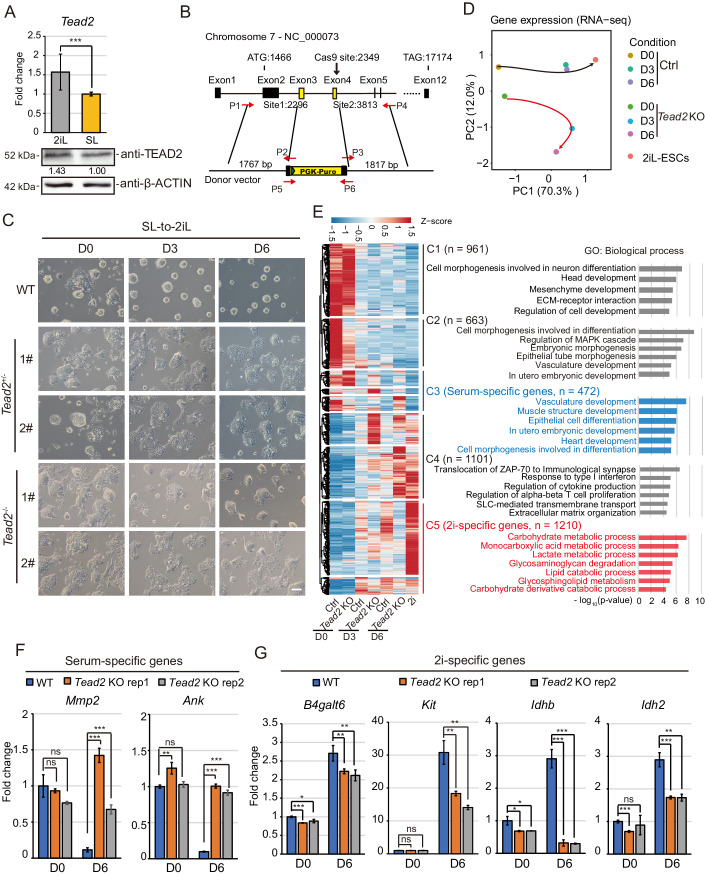
Figure 3. Effect of Tead2-knockout on colony formation and gene expression during SL-to-2iL transition.
(A) RT-qPCR and Western blot examining TEAD2 expression in both 2iL- and SL-ESCs. mRNA expression was tested in triplicate in three independent experiments. Data are presented as the mean ± SD. P-values were determined using two-sided Student’s t-test (***p < 0.001). Quantification of protein signal was performed using Fiji image analysis software. (B) Strategy of generating Tead2-knockout cell lines in SL-ESCs. (C) Representative cellular morphologies of wild-type ESCs and two clones of Tead2−/− and Tead2+/− ESCs during the SL-to-2iL transition at day 0, 3, and 6. Scale bar, 100 μm. (D) PCA of the RNA-seq data from wild-type ESCs and Tead2-knockout ESCs collected at different time points during the SL-to-2iL transition. (E) Heatmap of the expression of 2i- and serum-specific genes during the SL-to-2iL transition with or without Tead2-knockout. Clustering analysis and the enrichment of GO terms in each group of genes are also provided. The enrichment p-value was calculated by using Metascape software. (F, G) RT-qPCR analysis testing the expression of serum-specific genes (F) and 2i-specific genes (G) in wild-type and Tead2-knockout cells on day 0 and day 6 of the transition. Data are presented as the mean ± SD. Indicated significances are testing using Student’s t-test analyses (*p < 0.05, **p < 0.01, ***p < 0.001). n = 3 biological replicates. Source data are available online for this figure.

