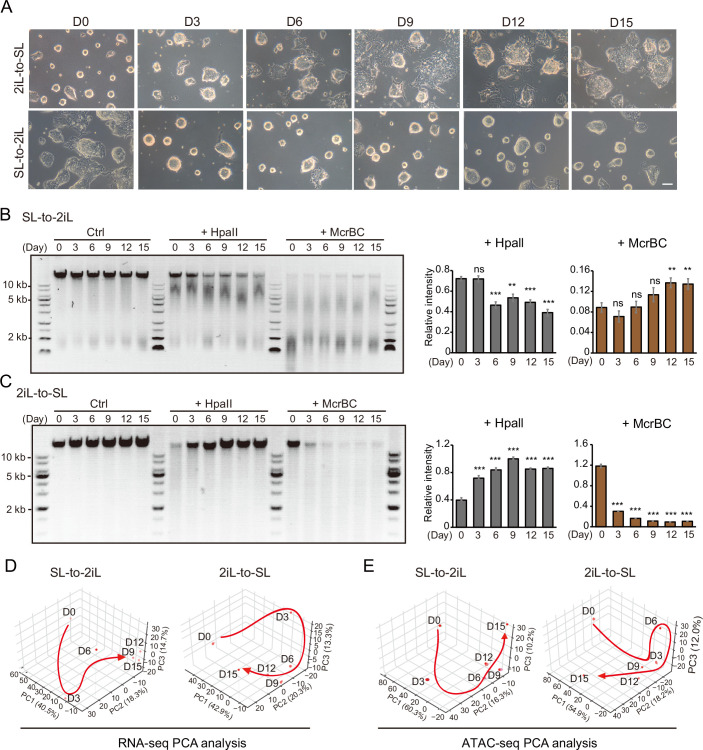
Figure EV1. Dynamic conversion between 2iL-ESCs and SL-ESCs.
(A) Dynamic changes of mESC morphology during the 2iL-to-SL transition from day 0 to day 15 or during the SL-to-2iL transition from day 0 to day 15. Scale bar, 100 μm. (B, C) CpG methylation levels of genomic DNA measured by digestion with the methylation-sensitive restriction enzymes HpaII and McrBC at different time points during the SL-to-2iL (B) and 2iL-to-SL (C) transitions. Quantification of DNA signals of the upper band of the agarose gel using Fiji image analysis software. Data is presented as the mean ± SD. Indicated significances are tested using Student’s t-test analyses (**p < 0.01, ***p < 0.001). n = 3 replications. M, DNA ladder. (D, E) PCA of RNA-seq data (D) and ATAC-seq data (E) during the transition between 2iL-ESCs and SL-ESCs at different time points.

