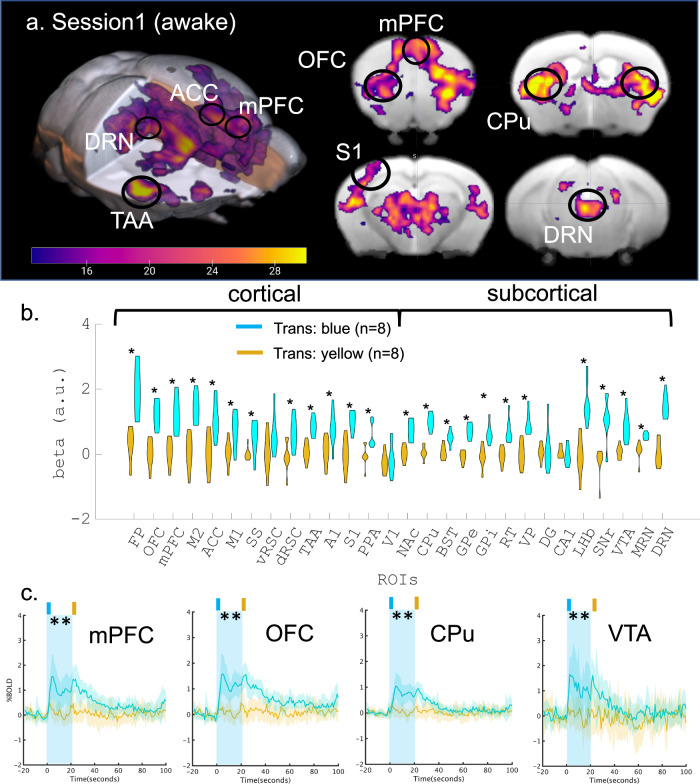
Fig. 2. BOLD response to optogenetic stimulation of serotonin neurons in the DRN.
a Functional map of optogenetic illumination. A functional map was calculated by contrasting BOLD responses between blue and yellow illumination in the transgenic (n = 8) group (pFWE-corrected < 0.05, two-tailed paired t-tests and cluster-corrected controlling family-wise error (FWE) with probabilistic threshold-free cluster enhancement (pTFCE, see “General Linear Model (GLM) for BOLD signals” section)). Magenta color indicates the t-value. b Comparison of beta values in multiple ROIs. Beta values were obtained from GLM analysis in Session 1, and were extracted and averaged based on ROIs from the Allen Brain Atlas (Table 1). Differences of beta values between blue and yellow illumination sessions were contrasted in the transgenic group. * indicates pFDR-corrected < 0.05 (Two-tailed paired t-tests were performed, and multiple comparison was corrected with false discovery rate (FDR)). Cyan and magenta colors indicate blue and yellow illumination, respectively. c Alignment of average % BOLD responses in the mPFc, OFC, CPu, and VTA. % BOLD responses were aligned at the time of blue illumination (1.0 s) in Session 1. Blue illumination (1.0 s; 473 nm) was applied at the onset of stimulation, and yellow illumination (1.0 s; 593 nm) followed 20 s the offset of the stimulation after blue illumination. A cyan window indicates stimulation duration during a session for 20 s. Blue and yellow lines indicate % BOLD responses in the mPFc, OFC, CPu, and VTA from blue and yellow illumination from transgenic groups (n = 8), respectively. Blue and yellow highlights indicate the range of mean values ± SD. A cyan window indicates stimulation duration during a session for 20 s. ** indicates pFDR-corrected < 0.01 with two-tailed t-tests, FDR corrected.

