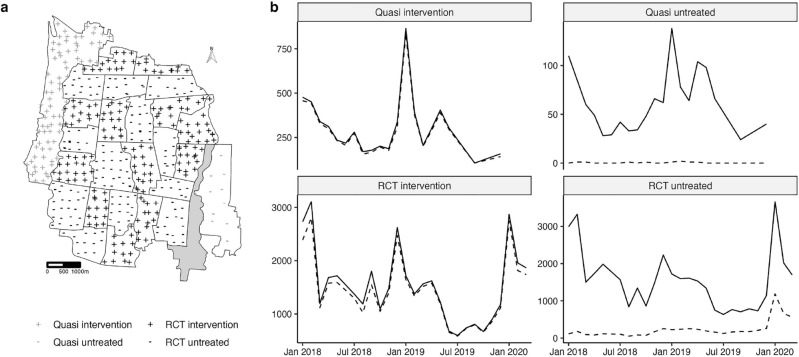
Figure 2.
(a) Map of Yogyakarta City with geolocated trap locations. Shape is used to distinguish intervention areas where wMel releases occurred (‘+’) and untreated areas where wMel releases did not occur (‘−’). Traps within the AWED RCT study boundaries are denoted in black, while those in the quasi-experimental areas are marked in gray. (b) The total number of mosquitoes screened (solid line) and the number of mosquitoes with wMel detected (dashed line) per month by study area.

